01 Client Overview
MG
Type
Marketplace Growth Agency
Portfolio
15,083 Active Products (of 24,139 total)
Plan & Tenure
Professional, $89/mo, since Dec 2025
This is a marketplace growth agency specializing in Amazon account management, advertising optimization, and operational support for brands selling across marketplaces. Based in India and acquired through an in-person industry conference, the agency manages a portfolio of seller accounts spanning thousands of products — handling everything from campaign setup and bid management to profitability analysis and reimbursement recovery.
The agency's model is hands-on: each client gets dedicated attention for advertising strategy, performance monitoring, and operational health. But as the client roster grew, so did the complexity — jumping between Seller Central accounts, pulling separate ad reports for each client, and manually tracking profitability across portfolios was consuming the hours that should have been spent on strategy.
The team expanded from one to two within a month of adopting KwickMetrics, a signal that the platform enabled more capacity by eliminating the operational overhead.
02 The Challenge
More clients, more accounts, and a reporting pipeline held together with spreadsheets
Every new client meant another Seller Central login, another set of ad reports to download, another spreadsheet to maintain. The agency was managing thousands of products across multiple seller accounts, and the operational overhead of simply gathering data was eating into the time available for actual strategy and optimization.
Advertising was the core service — and the biggest data challenge. With $89,000 in client ad spend flowing through campaigns every month, the agency needed to monitor ACoS, ROAS, keyword performance, and bid efficiency across every client account, every day. But Amazon's native reporting is account-by-account, and each client's data lived in its own silo. Comparing performance across the portfolio, identifying which clients needed attention first, and catching wasted spend before it accumulated — all of that required manual assembly.
Profitability reporting was another bottleneck. Clients expected to understand their true margins — not just revenue and ad spend, but the full picture including Amazon fees, FBA costs, returns, and reimbursements. Building those reports manually for each client, each week, was unsustainable.
And then there were the reimbursements. Amazon owes sellers money for lost inventory, damaged goods, and fee overcharges — but most sellers (and their agencies) never claim it because the process is buried and tedious. Across the agency's client base, that unclaimed money was sitting in Amazon's pocket, invisible.
03 Objectives
What the agency needed to solve
- Consolidate ad performance — ACoS, ROAS, keyword performance, bid efficiency — across every client account into one portfolio view.
- Build true profitability reports (Amazon fees, FBA costs, returns, reimbursements) for every client without a manual weekly rebuild.
- Identify and file reimbursement claims across the entire client base, instead of leaving Amazon-owed money unclaimed.
- Prioritize which clients need attention first, using live, side-by-side portfolio data.
- Scale the client roster without scaling operational overhead 1:1 with headcount.
04 Before State
Jumping between logins, one spreadsheet per client
Before KwickMetrics, every new client meant another Seller Central login, another set of ad reports downloaded by hand, and another spreadsheet added to the pile. Comparing performance across the portfolio — which clients needed attention first, where spend was being wasted — required manually assembling each client's numbers before any comparison could happen.
Reimbursement claims went unfiled entirely. Amazon owed money back for lost inventory, damaged goods, and fee overcharges across the client base — but the process was buried and tedious enough that, without a system actively surfacing it, it simply never got claimed.
05 Solution
How KwickMetrics Helped
With KwickMetrics' multi-store management connected to all client accounts, the agency sees every client's ads, profit, and inventory from one login. The team doubled in month two.
They stopped juggling Seller Central logins and started managing a portfolio.
Why It Matters: Hours Given Back to Strategy
Agencies are paid for their expertise, not their ability to download CSVs. Every hour spent assembling reports is an hour not spent optimizing campaigns, advising clients, or growing the portfolio. KwickMetrics eliminated the data-gathering overhead and gave the team back the time to do the work clients actually pay for. The reimbursement discovery alone justified the platform many times over — $155,762 in unclaimed reimbursements had been sitting undetected.
How KwickMetrics fits into the agency's workflow
01
See — Every Client's Data in One Portfolio View
Monitor performance, profitability, and reimbursements across all accounts: cross-client ad performance with ACoS, ROAS, and spend breakdowns; SKU-level profitability across 15,083 active products; client-by-client comparison of advertising efficiency; and reimbursement status across all accounts, flagged and claim-ready.
02
Act — Optimize $89K/mo in Client Ad Spend From One Place
Identify issues, prioritize action, and recover lost revenue: identify underperforming campaigns across the entire portfolio at once; flag wasted search terms and budget leaks per client account; prioritize which clients need immediate attention based on live data; and submit reimbursement claims with data pre-compiled — $155,762 identified.
03
Stay Ahead — Scale the Team Without Scaling the Overhead
Automate reporting and monitor portfolio health as the business grows: a second team member onboarded in month two, working from the same data and same view; automated client reports replacing hours of manual spreadsheet building; an executive dashboard for portfolio-level health checks; and proactive alerts for margin drops, inventory risks, and ad waste.
What powered the agency's turnaround
- Single portfolio login: Every client's Seller Central and Ads console data accessible from one place.
- SKU-level profitability at portfolio scale: Profitability tracked across all 15,083 active client products, not just top-line ad metrics.
- Reimbursement claims flagged and pre-compiled: $155,762 identified across the entire client base — money that had been sitting unclaimed.
- Automated client reporting: Replacing hours of manual spreadsheet building for every client, every week.
- Team scaled from one to two: Within the first month of adoption, working from the same data and same view.
06 Results & Outcomes
What eight months of centralized agency analytics looks like
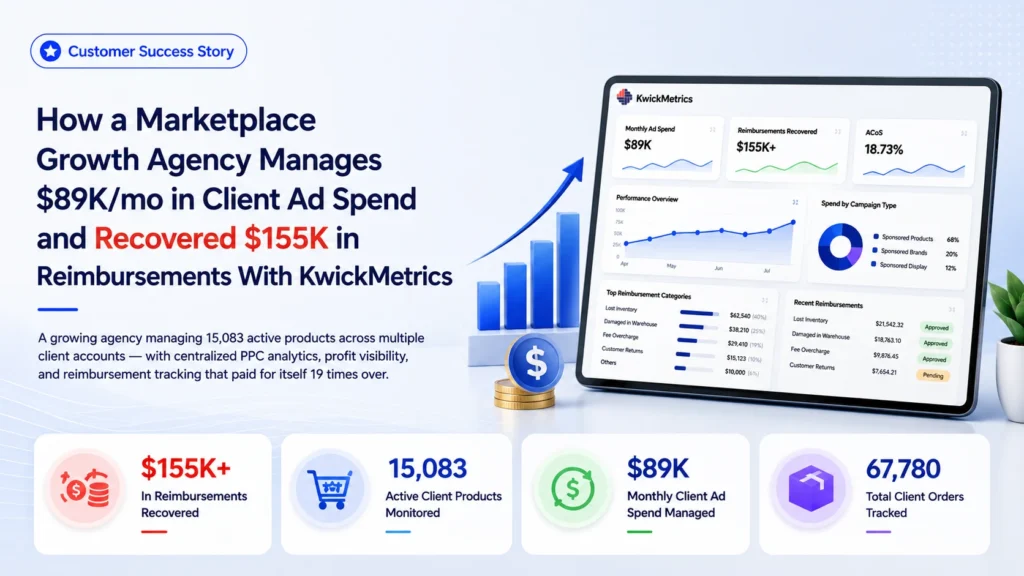
Consolidated metrics since December 2025. As with adoption-focused agency case studies, results center on portfolio-wide ad spend monitoring and reimbursement recovery rather than a per-client revenue/margin table.
| Metric | Value | What it covers |
|---|---|---|
| Unclaimed reimbursements identified | $155,762 | Previously invisible across client accounts |
| Client ad spend monitored | $89K/mo | Cross-portfolio performance visibility |
| Total client orders tracked | 67,780 | Full profitability data per account |
| Portfolio size | 15,083 active products | Of 24,139 total across client accounts |
| Team size | 1 → 2 | Expanded within the first month of adoption |
| Plan & tenure | Professional, $89/mo | Multi-client access, since December 2025 (~8 months) |
Money Kept, Not Just Measured
136×
$155,762 in recovered reimbursements. At a Professional plan cost of roughly ₹95,000/year (~$1,140), the platform paid for itself more than 136 times over in reimbursement recovery alone — before counting ad efficiency gains, time saved on reporting, or capacity freed for new client acquisition.
This isn't a one-off analysis. The team went from one to two within the first month — not a hiring decision driven by workload, but a capacity signal. When the operational overhead of managing data is eliminated, an agency can handle more clients with fewer hours. KwickMetrics didn't replace the team; it made the team scalable.
We were spending more time pulling data from Seller Central than actually analyzing it. Now we see every client's ads, margins, and reimbursements in one view — and the $155K we found in unclaimed reimbursements? That was money our clients didn't even know they were owed.
AL
Agency Lead
A Marketplace Growth Agency · Amazon
07 Key Takeaway
What this agency can do now
The team no longer jumps between individual Seller Central logins to assemble a client's numbers before comparing them against another. Every client's ads, profit, and inventory now sit in one portfolio view — the same view that flagged $155,762 in reimbursements Amazon owed but nobody had claimed.
That shift shows up as a team that doubled within the first month — not a hiring decision driven by workload, but a capacity signal that the operational overhead had been removed. Reimbursement claims that used to go unfiled are now flagged and pre-compiled, and client reporting that used to take hours now comes from an automated view.
The real value isn't the data — it's the hours given back to strategy
Agencies are paid for their expertise, not their ability to download CSVs. Every hour spent assembling reports is an hour not spent optimizing campaigns, advising clients, or growing the portfolio. KwickMetrics didn't replace this agency's team; it made the team scalable — doubling capacity instead of just adding headcount.
Manage your client portfolio from one platform
Whether you handle 5 accounts or 50 — KwickMetrics gives agencies the cross-client visibility to optimize faster, report smarter, and catch revenue that's being left on the table.
Start 14-Day Free Trial →