01 Client Overview
HI
A Niche Home Improvement Brand
Category:Home Improvement (Niche — gutter protection, outdoor living)
Marketplace:Amazon + Walmart
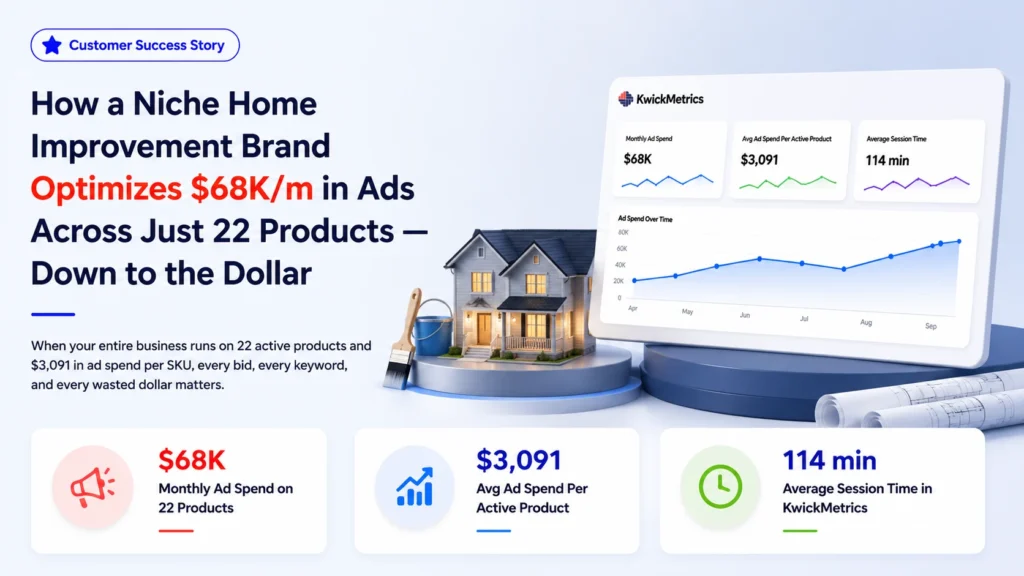
This is a niche home improvement brand specializing in a focused product line — the kind of catalog where every SKU is hand-picked, purpose-built, and expected to carry its own weight. Based in the United States, the brand sells across both Amazon and Walmart, with 22 active products on Amazon and 19 on Walmart. What makes this operation unusual is the ratio of ad spend to catalog size: at $68,000 per month spread across just 22 active products, each SKU absorbs an average of $3,091 in monthly advertising investment — a level of per-product spend where vague campaign metrics aren't enough. The brand owner spends an average of 114 minutes per session inside KwickMetrics — the deepest daily usage across all customers analyzed. The brand has been on KwickMetrics's Professional plan (~$634/mo, yearly commitment) since April 2025.
02 The Challenge
When you spend $3,091 per product per month on ads, guessing isn't an option
Most Amazon sellers optimize ads at the campaign level — total spend, overall ACoS, aggregate impressions. That works when you have hundreds or thousands of products and the numbers average out. But when your entire catalog is 22 products and you're spending $68,000 a month, averages are meaningless. Every product is a significant investment, and every underperforming keyword is a measurable loss.
The brand was running advertising across Amazon and expanding into Walmart, but Amazon's native campaign manager doesn't make it easy to connect ad spend to true product-level profitability. The owner could see ACoS at the campaign level, but not what each product actually cost — including Amazon fees, FBA storage, returns, and ad spend combined — or whether the margin left over justified the advertising investment.
Multi-marketplace complexity added another layer. With 22 products on Amazon and 19 on Walmart, the brand needed to compare performance across both marketplaces without bouncing between two completely different reporting systems. Which products were performing better on Walmart? Was the ad spend allocation between marketplaces optimized? Those questions required unified data.
And with a yearly Professional plan commitment at ~$634/mo, the brand wasn't experimenting — they needed a tool that earned its keep every day.
03 Objectives
What this brand needed to solve
Based on the gaps in campaign-level averaging at high per-SKU ad spend, the goals were clear:
- Get true per-SKU profitability — Amazon fees, FBA storage, returns, and ad spend combined — not just campaign-level ACoS.
- Identify underperforming keywords at the individual SKU level, given that each product carries $3,091/month in ad spend on average.
- Compare performance across Amazon and Walmart for overlapping products, in one unified view.
- Flag products running above target ACoS before they drain more budget.
- Track Walmart product launches against organic rank growth as the marketplace expansion builds.
04 The Solution
What changed with KwickMetrics
With KwickMetrics connected to both Amazon and Walmart, the brand sees exactly what each product costs, earns, and returns — across both marketplaces — in a single platform. They went from campaign-level guessing to per-SKU precision.
When you sell 22 products, you don't have the luxury of a long tail to absorb mistakes. There's no "it averages out" — every product is a meaningful percentage of the business, and every advertising dollar is an investment that needs a measurable return.
The core shift
The 114-minute average session time isn't a vanity metric — it's evidence that KwickMetrics is the brand's operational cockpit. Not a dashboard they glance at once a week, but the place where the real analytical work happens every day.
05 How KwickMetrics helped
See, act, stay ahead
See — per-product economics at the SKU level
Understand true profitability with a complete view of costs, advertising, and margins: full cost breakdown per SKU — ad spend, Amazon fees, FBA costs, returns, and COGS; $3,091/product in ad spend tracked with keyword-level performance data; margin calculations that include all costs, not just revenue minus ad spend; and an Amazon vs. Walmart comparison for overlapping products.
Act — optimize every dollar of $68K/mo in ad spend
Quickly identify opportunities to improve efficiency and increase returns: identifying underperforming keywords at the individual SKU level, flagging the 4 products running above target ACoS before they drain more budget, shifting ad spend toward the 18 products delivering positive returns, and tracking Walmart product launches to adjust strategy as organic rank builds.
Stay ahead — 114-minute daily sessions that prevent waste before it starts
Stay on top of profitability, inventory, and marketplace performance every day: daily deep-dives into per-product ad efficiency and margin health, multi-marketplace inventory alignment between Amazon and Walmart, compliance-grade data tracking and reporting, and a yearly commitment now spanning 16 months of continuous analytical work.
16 months in, with no churn signal
The yearly plan commitment tells the story. At ~$634/mo, the Professional plan isn't cheap for a 22-product brand — but 16 months in, with 114-minute daily sessions and no churn signal, the platform has earned its place as the core analytical tool, not a nice-to-have.
What powered the results
- Full per-SKU cost breakdown: ad spend, Amazon fees, FBA costs, returns, and COGS combined into one margin figure per product.
- Keyword-level precision: performance tracked at the individual keyword level against $3,091/product average monthly ad spend.
- Amazon vs. Walmart comparison: overlapping products compared side by side in one unified view.
- Daily 114-minute analytical sessions: the deepest daily usage across all customers analyzed, catching issues before they compound.
- 16 months of continuous use: a yearly plan commitment with no churn signal, treated as core infrastructure rather than a nice-to-have.
06 Results & Outcomes
What 16 months of precision PPC management looks like
Consolidated metrics since April 2025.
Avg. Ad Spend Per Product
$3,091
tracked at the keyword level, per month
Avg. Session Time
114 Min
deepest daily usage across all customers analyzed
Total Products Monitored
41
22 on Amazon + 19 on Walmart, full P&L
Tenure on KwickMetrics
16 Mo.
since April 2025
Before vs After
Before KwickMetrics
Ad optimization levelCampaign-level ACoS only
Per-SKU marginUnknown, not isolated from fees
Amazon vs. Walmart viewTwo separate reporting systems
Ad spend justificationGuessed, not measured
With KwickMetrics
Ad optimization levelIndividual keyword, per SKU
Per-SKU marginFull cost breakdown, all fees included
Amazon vs. Walmart viewUnified, side by side
Ad spend justificationMeasured daily, 114-min sessions
Scale, by the numbers
| Metric | Value | What it covers |
|---|---|---|
| Average ad spend per product | $3,091/mo | Tracked at the keyword level |
| Average session time | 114 min | Deepest daily usage across all customers analyzed |
| Total products monitored | 41 (22 AMZ + 19 WMT) | Full P&L per product, both marketplaces |
| Products flagged above target ACoS | 4 of 22 | Flagged before draining more budget |
| Products delivering positive returns | 18 of 22 | Spend shifted toward these |
| Tenure on KwickMetrics | 16 months | Since April 2025, Professional plan (~$634/mo, yearly commitment) |
At $68K/mo, a 5% improvement in ad efficiency means $3,400 saved every month — $40,800 per year. Identifying and cutting waste on the 4 underperforming products — even at a conservative $500/mo per product — recovers $24,000 per year. Add the Walmart expansion insights, the time saved versus manual reporting, and the margin clarity across both marketplaces, and the ROI on the yearly plan is clear.
The 114-minute average session time isn't a vanity metric — it's evidence that KwickMetrics is the brand's operational cockpit. Not a dashboard glanced at once a week, but the place where the real analytical work happens every day.
07 Testimonial
In their own words
When you only have 22 products and you're spending $3,000 per product on ads, you need to know — not guess — whether each one is earning that back. KwickMetrics gives me that answer every morning before I decide where to put the next dollar.
BO
Brand Owner
A Niche Home Improvement Brand · Amazon + Walmart
08 Key Takeaways
What this brand can do now
The team no longer optimizes on campaign-level averages. Every one of the 22 Amazon products and 19 Walmart products has a full per-SKU cost breakdown — fees, FBA, returns, COGS, and ad spend combined — visible in one platform, compared side by side across both marketplaces.
That precision is applied daily: 4 products flagged above target ACoS, 18 delivering positive returns, spend shifted accordingly. The relationship has run for 16 months on a yearly plan commitment, with 114-minute average daily sessions and no churn signal — evidence the platform is core infrastructure, not a nice-to-have.
What this story proves
Key Takeaway
For niche brands, the analytics have to be as precise as the products. When you sell 22 products, there's no long tail to absorb mistakes — every product is a meaningful percentage of the business, and every advertising dollar needs a measurable return.
What changes the picture is per-SKU precision: full cost breakdowns down to the keyword level, a unified view across Amazon and Walmart, and daily analytical sessions that catch underperformance before it compounds.
- Averages are meaningless at low SKU counts: at $68K/mo across 22 products, every underperforming keyword is a measurable loss, not statistical noise.
- Small efficiency gains still compound fast: a 5% improvement in ad efficiency on $68K/mo is $3,400/month, or $40,800/year.
- Multi-marketplace comparison needs a unified view: comparing 22 Amazon products against 19 Walmart products in one place replaces switching between two separate reporting systems.
Know exactly what every product costs and earns
Whether you run 20 products or 20,000 — KwickMetrics gives you per-SKU profitability and ad performance visibility that turns data into decisions.
Start 14-Day Free Trial →