01 Client Overview
Who is Zion4Commerce
Z4
Type
Amazon Agency
Brands
12 Managed
Markets
US · UK · India
Catalog Span
94 – 35,000+ SKUs
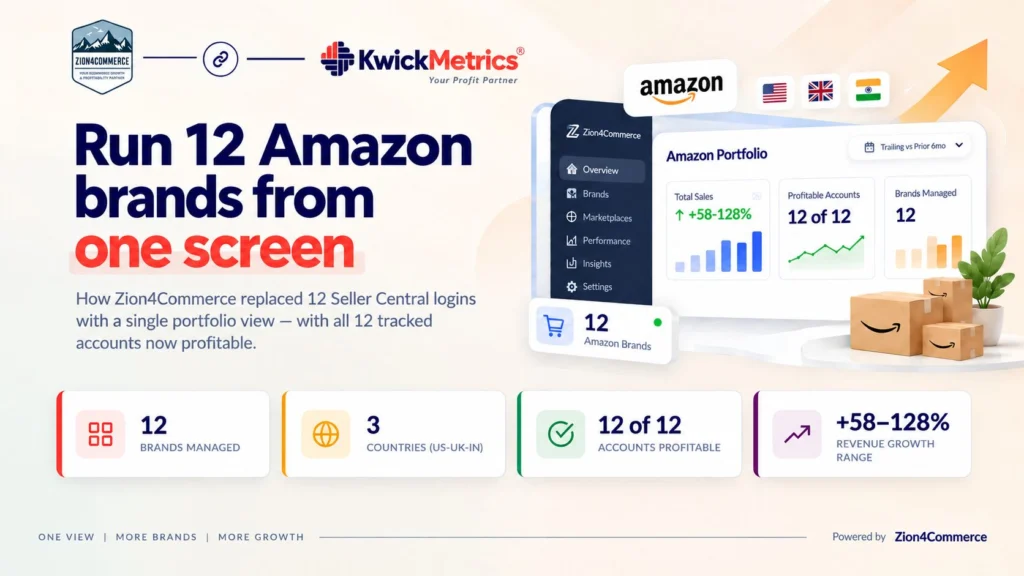
Zion4Commerce is an Amazon management agency. They handle advertising, operations, and growth for 12 brands selling across Amazon US, Amazon UK, and Amazon India. Their portfolio is mixed: catalog sizes range from 94 SKUs to over 35,000. Billing currencies span USD, GBP, and INR. Every account has its own Seller Central login, its own Ads console, and its own set of reports.
02 The Challenge
Reporting overhead that scaled linearly with clients
12 brands across three marketplaces meant 12 separate logins to Seller Central and 12 separate Ads consoles. Checking one client's profit margin required pulling that account's data manually. Comparing ACoS across the portfolio meant repeating that pull 11 more times, then stitching numbers into a spreadsheet — in three different currencies.
That is the core problem for any multi-account Amazon agency: reporting overhead grows linearly with the number of clients. Every new brand adds another login, another manual pull, another row in the spreadsheet. Spotting which client is overspending on ads or slipping on margin takes longer as the portfolio grows. The work is repetitive, not complex — but it compounds.
Most competing amazon seller analytics tools charge per account. For an agency with 12 brands, that multiplier is the difference between a tool they can justify and one they cannot. The cost itself becomes a scaling problem.
03 Objectives
What Zion4Commerce needed to solve
- Consolidate 12 Seller Central and 12 Ads console logins into a single portfolio view.
- Track revenue, profit, ACoS, ROAS, and return rate across every managed brand side-by-side.
- Compare account performance across three currencies (USD, GBP, INR) without spreadsheet rebuilds.
- Spot underperforming accounts before month-end reports land.
- Standardise weekly and monthly reporting regardless of catalog size (94 vs. 35,000+ SKUs).
- Avoid per-account fees that punish agency growth.
04 Before State
12 logins, one spreadsheet, no consolidated view
Before KwickMetrics, the Zion4Commerce team cycled through individual Seller Central and Ads console logins to build each client's report. Portfolio-level comparisons — which account has the best margin this month, which has the worst ACoS — required a manually assembled spreadsheet. Currencies were not converted; they were simply listed side by side and compared mentally or with a separate calculation.
An account health check meant a manual pull per client. There was no single view of the full portfolio. Weekly reporting was a rebuild-from-scratch exercise.
05 Solution
How KwickMetrics Helped
KwickMetrics' multi-account overview replaced the twelve-login routine. All twelve brands — across US, UK, and India — feed into one amazon seller dashboard. Revenue, profit, ACoS, ROAS, and return rate sit side by side. The team sorts, filters, and compares without opening Seller Central.
The dashboard did not change the agency's strategy. It changed the speed. Spotting which client is overspending or slipping on margin went from a manual pull per account to a single query. A reporting cycle that required assembling data from twelve sources now starts from a pre-built view.
MCP: The Portfolio, in Plain Language
KwickMetrics' MCP connector lets Zion4Commerce query every managed account from inside Claude — "which account has the highest ACoS this month," "compare all accounts' profit margin vs. last month" — without opening a dashboard at all. Multi-account reporting becomes a conversation, not a spreadsheet export.
How KwickMetrics fits into the agency workflow
01
Portfolio Overview
One login, one screen. The multi-account view shows revenue, profit, ACoS, ROAS, and return rate for every managed brand. The team sorts by any column to find which client needs attention first.
02
Amazon FBA Analytics Per Account
When a metric looks off in the portfolio view, the team drills into that account's detail — P&L by product, ad campaign performance, return rate breakdown. No separate login required.
03
PPC Oversight Across the Book
ACoS, ROAS, and TACoS are tracked the same way for every account. An amazon PPC optimization playbook that works for one client transfers to the next without relearning a different reporting format.
04
Consistent Reporting
Weekly and monthly reports pull from the same data source regardless of catalog size (94 SKUs vs. 35,000+) or currency (USD, GBP, INR). No spreadsheet rebuild.
What powered the agency's turnaround
- Unified profit lens: Every account tracked on the same P&L logic — revenue after Amazon fees, FBA, returns, and ad spend — so cross-client comparisons became meaningful.
- PPC standardisation: A single ACoS/ROAS view across all clients let the team lift a winning playbook from one brand and apply it to the next without relearning tooling.
- Currency-agnostic tracking: INR, GBP, and USD accounts sit in the same dashboard, each in its own currency, without forcing a conversion the team didn't ask for.
- MCP-powered querying: Portfolio questions get asked in plain language inside Claude — no dashboard export required.
- Flat pricing: Adding a 13th brand doesn't add a 13th subscription line. Agency growth stops being punished by tooling cost.
06 Results & Outcomes
Portfolio results — trailing 6 months vs. prior 6 months
Every account grew revenue, with growth ranging from +58% to +128%. All 12 accounts improved from negative or low prior-period margins into positive profitability, while Client G moved from a −11.2% loss to a 5.0% profit margin. Profit margins across the portfolio now range from 5.0% to 16.6%. Currency is each account's own billing currency — figures are not converted or summed across the row.
| Account | Currency | Revenue (current) | Growth | Net Profit (current) | Profit Margin |
|---|---|---|---|---|---|
| Client A | INR | ₹86,42,750 | +128% | ₹14,38,210 | 16.6% (from 4.2%) |
| Client B | USD | $1,284,600 | +94% | $192,690 | 15.0% (from 6.8%) |
| Client C | USD | $947,320 | +117% | $151,571 | 16.0% (from 8.5%) |
| Client D | USD | $624,850 | +76% | $78,731 | 12.6% (from 2.9%) |
| Client E | USD | $418,275 | +63% | $50,193 | 12.0% (from −3.4%) |
| Client F | GBP | £286,540 | +89% | £34,385 | 12.0% (from −1.8%) |
| Client G | USD | $164,780 | +71% | $8,239 | 5.0% (from −11.2%) |
| Client H | USD | $118,460 | +58% | $14,215 | 12.0% (from 3.7%) |
| Client I | INR | ₹52,76,480 | +82% | ₹7,91,472 | 15.0% (from 5.6%) |
| Client J | USD | $342,750 | +69% | $41,130 | 12.0% (from 3.8%) |
| Client K | USD | $275,640 | +74% | €37,212 | 13.5% (from 2.4%) |
| Client L | USD | $196,420 | +61% | $21,606 | 11.0% (from 1.9%) |
Note: these are trailing-6-month vs. prior-6-month comparisons within KwickMetrics, not formal before/after figures anchored to a signup date. Actual onboarding dates should be confirmed with each brand for a precise cutover comparison.
KwickMetrics turned a 12-login morning into a single sortable table. We stopped rebuilding reports and started running the agency.
A
Arjun
Zion4Commerce
07 Key Takeaway
What Zion4Commerce can do now
The team checks portfolio health in one view instead of twelve logins. A client review that used to mean pulling data from Seller Central, assembling it in a spreadsheet, and comparing it against last week's version now starts from a pre-built, sortable table.
When something moves — a client's ACoS spikes, a margin drops — the team sees it in the same session where they are reviewing every other account. They do not discover it at month-end when a report lands.
New clients add to the same view, without a per-account fee and without rebuilding the reporting structure.
Reporting overhead shouldn't grow with headcount
An agency's reporting overhead should not grow in step with its client count. If adding a 13th brand means a 13th login and a 13th manual data pull, the agency's operating model gets heavier every time it grows. KwickMetrics made that overhead flat for Zion4Commerce: one login, one view, same process whether the portfolio has 3 brands or 30.
Bring every client account under one login
No per-account fees. No per-brand spreadsheet rebuilds. See revenue, profit, and PPC efficiency for your whole portfolio in one sortable view.
Connect Your First Account Free →