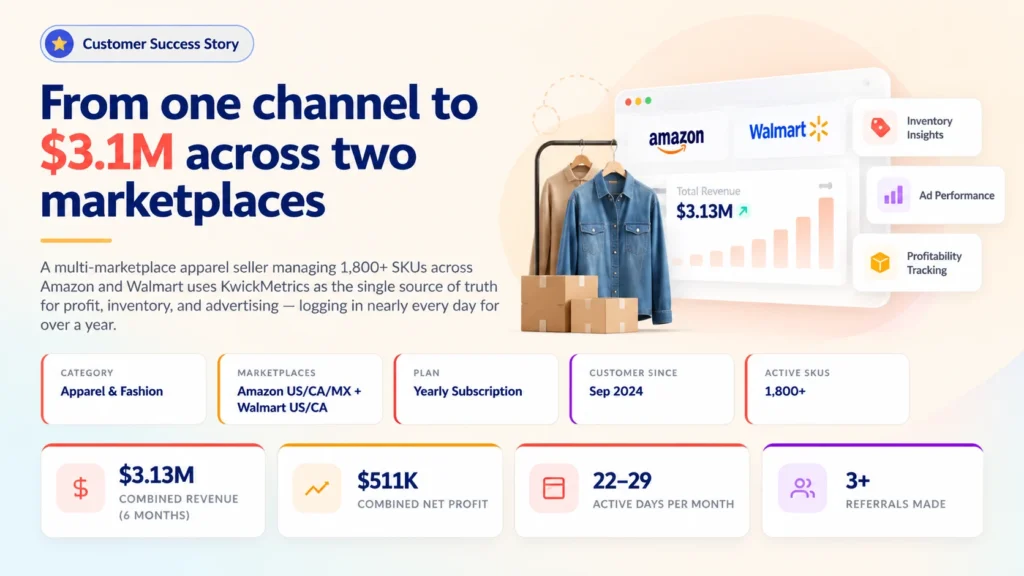
01 Client Overview
The client at a glance
Multi-Marketplace Apparel Seller
Category: Apparel & Fashion
Marketplaces: Amazon US, CA, MX + Walmart US, CA
Account Type: Seller
This is a fast-growing apparel brand operating at scale across five marketplace channels. With 655 active Amazon products and over 1,000 Walmart SKUs, the business generates over $3 million in combined revenue every six months. The account has been a KwickMetrics subscriber since September 2024, currently on a yearly plan.
The business runs on both Amazon (US, Canada, Mexico) and Walmart (US, Canada), with Walmart Ads fully connected. This is a business that treats its analytics platform as infrastructure, not as an occasional reporting tool.
02 The Challenge
Multi-marketplace visibility at scale
The business operates across five marketplace channels with 1,800+ SKUs in the apparel category. The core operational challenge was clear: understanding profitability at scale, across marketplaces, without drowning in manual spreadsheet assembly.
"The business needed to answer one question across every channel: after every fee, return, and ad cost — what did we actually keep?"
Support ticket history reveals the specific pain points that brought them to KwickMetrics:
- Cross-marketplace profit visibility: No single place to see true P&L across Amazon and Walmart after all fees and returns.
- Inventory planning across channels: Separate systems for Amazon FBA and Walmart WFS meant no unified restock view.
- PPC and organic split: Ads and organic sales were tracked separately, making TACoS analysis manual.
- Historical reporting gaps: Limited date range visibility and inability to compare long time periods.
- Consolidated reporting: The team needed to export inventory, sales, and category data in formats compatible with their internal workflows.
03 Adoption Journey
From trial to daily operating system
The customer signed up in September 2024. Within three weeks, the trial converted to a paid subscription. Over the next 12 months, the platform became the daily operating dashboard for the business.
September 2024 — Trial and onboarding
Account created September 13. Amazon US marketplace connected immediately. Trial period ran through October 8, 2024. By the end of the trial, the team was already logging in regularly.
October 2024 — Paid conversion and daily adoption
Converted to a paid plan. The data shows 19 active days in October 2024, with 3,004 total events — the team embedded KwickMetrics into their daily routine from the start.
Q1 2026 — Deepening engagement and feature requests
Active days reached 25–29 per month. Support tickets shifted from data questions to feature requests: TACoS on dashboard, category-level grouping in ads, extended date ranges. This marks the transition from consumer to power user.
Q2–Q3 2026 — Multi-marketplace expansion and MCP
Walmart Canada connected. MCP access requested and granted. Customer began using AI-assisted features, contributing 31,000+ AI span events. Walmart Ads fully integrated.
04 Product Usage & Adoption
What they use and how often
The data across the last 12 months shows near-daily usage across core product features, with consistent engagement that did not fade after onboarding.
Most-Used Features
| Feature | Usage Pattern |
|---|---|
| Product Trends | Primary daily view — SKU-level trend analysis across all marketplaces |
| Dashboard | Daily health check — account-level overview of sales, profit, and orders |
| PPC Reports | Weekly ad performance review — spend, ACoS, ROAS across campaigns |
| Inventory Report | Regular restock planning — days of supply, inbound status, reorder alerts |
| Category Reports | Category-level performance segmentation — identifying top and bottom performers |
| Inventory Export | Data export for internal planning — feeding external workflows and spreadsheets |
| Profit & Loss | Periodic profitability review — true P&L after every fee, return, and ad cost |
| SQP (Search Query) | Search term analysis — identifying high-converting keywords and ranking shifts |
AI feature adoption
Over 31,000 AI span events in the last 6 months indicate active use of KwickMetrics' AI-powered features, including AI recommendations and Ask AI. The team also requested MCP access, further demonstrating appetite for advanced platform capabilities.
05 Results & Outcomes
Business performance tracked in KwickMetrics
Amazon US — Trailing 6 Months (Apr–Sep 2026)
Revenue
$1.62M
Net Profit
$172.9K
Profit Margin
14.4%
Orders
75,463
Walmart US — Trailing 6 Months (Apr–Sep 2026)
Revenue
$1.52M
Net Profit
$338.5K
↑ 3.6%
Profit Margin
25.1%
↑ 2.6%
Orders
61,012
Amazon vs Walmart Comparison
Amazon US (6 months)
Revenue$1,617,384
Net profit$172,922
Profit margin14.4%
Orders75,463
Units85,122
Walmart US (6 months)
Revenue$1,515,954
Net profit$338,488
Profit margin25.1%
Orders61,012
Units68,193
The cross-marketplace view reveals a critical insight that is invisible without a unified analytics platform: Walmart generates nearly 2× the profit margin of Amazon despite similar revenue. This kind of channel-level P&L comparison is exactly what KwickMetrics enables — and what manual spreadsheet assembly makes nearly impossible to maintain at this scale.
Before vs After KwickMetrics
The customer signed up in September 2024. KwickMetrics holds historical data from before signup, allowing a direct comparison between the 6 months before adoption and the most recent 6 months of use.
Before KwickMetrics (Mar–Aug 2024)
Combined Revenue$607,657
Combined Net Profit$206,254
Total Orders27,371
Amazon Revenue$606,666
Amazon Profit Margin42.7%
Walmart Revenue$992
Marketplaces Active1
With KwickMetrics (Apr–Sep 2026)
Combined Revenue$3,133,338
Combined Net Profit$511,410
Total Orders136,475
Amazon Revenue$1,617,384
Amazon Profit Margin14.4%
Walmart Revenue$1,515,954
Marketplaces Active5
Full Before vs After Breakdown
| Metric | Before KwickMetrics (Mar–Aug 2024) | With KwickMetrics (Apr–Sep 2026) | Change |
|---|---|---|---|
| Combined Revenue | $607,657 | $3,133,338 | +416% |
| Combined Net Profit | $206,254 | $511,410 | +148% |
| Total Orders | 27,371 | 136,475 | +399% |
| Total Units | 31,180 | 153,315 | +392% |
| Amazon US Revenue | $606,666 | $1,617,384 | +167% |
| Amazon US Orders | 27,336 | 75,463 | +176% |
| Amazon US Net Profit | $206,111 | $172,922 | −16% |
| Walmart US Revenue | $992 | $1,515,954 | +152,716% |
| Walmart US Net Profit | $144 | $338,488 | +235,000% |
| Walmart Profit Margin | 16.1% | 25.1% | +9 pts |
| Marketplace Channels | 1 | 5 | +4 channels |
The Walmart expansion story
Before KwickMetrics, Walmart was essentially dormant — $992 in revenue across 6 months, just 35 orders. Today, Walmart generates $1.52M in revenue with a 25.1% profit margin — nearly double Amazon's margin. Walmart now contributes 66% of the business's total net profit. The cross-marketplace P&L visibility that KwickMetrics provides was instrumental in identifying Walmart as the higher-margin channel and supporting the decision to scale aggressively into it.
Walmart Ads Performance (trailing 6 months)
Ad Spend
$253.7K
PPC Sales
$1.08M
ACoS
23.5%
ROAS
4.26
The Walmart Ads performance is efficient — a 4.26 ROAS and 23.5% ACoS on $253,662 in ad spend over 6 months, generating $1.08M in attributed PPC sales. The overall TACoS of 16.7% indicates strong organic contribution alongside paid traffic. This level of ad efficiency on Walmart — a channel that barely existed for this business before KwickMetrics — demonstrates how cross-marketplace profit visibility supports confident ad scaling decisions.
How KwickMetrics Supported This Growth
- Identified the higher-margin channel: With Amazon and Walmart P&L in a single view, the team could see Walmart's 25.1% margin vs Amazon's 14.4% — guiding where to allocate inventory, ad spend, and attention.
- Enabled confident Walmart scaling: Daily profit tracking by SKU gave the team the confidence to scale Walmart from $992 to $1.52M in revenue — knowing exactly which products were profitable at what ad spend level.
- Protected Amazon profitability during growth: While Amazon revenue grew 167%, the team used KwickMetrics' SKU-level P&L to manage the margin compression that comes with aggressive scaling, maintaining $173K in net profit.
- Supported Walmart Ads optimization: With Walmart Ads fully integrated, the team achieved a 4.26 ROAS while spending $253K — KwickMetrics' unified ads + profit view ensured ad spend was adding to the margin, not eating it.
- Expanded marketplace footprint: Moving from 1 marketplace to 5 (Amazon US/CA/MX + Walmart US/CA) requires a platform that can track profit across channels. Manual spreadsheets do not scale to this level.
Note: The "Before" period (Mar–Aug 2024) uses KwickMetrics' historical data imported at account connection. The "After" period (Apr–Sep 2026) reflects trailing 6-month actuals. The comparison shows performance in two non-adjacent windows, not a controlled experiment. Business decisions, market conditions, and product launches contributed alongside KwickMetrics' visibility. What KwickMetrics provided was the daily, per-SKU, cross-marketplace profit clarity that informed those decisions.
06 Support & Engagement
Responsive support, features delivered
Throughout the customer journey, the KwickMetrics support team maintained a fast, responsive engagement across phone, chat, and email. Queries were resolved quickly, and the relationship extended well beyond basic troubleshooting into collaborative product development.
- Quick resolution on data queries: When the customer raised questions about data accuracy in P&L reports, inventory figures, or dashboard metrics, the support team investigated and resolved each issue promptly — maintaining trust in the platform's numbers.
- Feature requests acted on: The customer submitted multiple feature requests — TACoS visibility on the dashboard, conversion rate in Product Trends, category-level grouping in PPC, extended date ranges, and export enhancements. Several of these were built and shipped, demonstrating that customer feedback directly shaped the product roadmap.
- Seamless marketplace expansion: When the business expanded into new marketplaces including Walmart Canada, the support team guided the integration setup and resolved data syncing issues quickly, ensuring minimal disruption to daily operations.
- Proactive engagement: Support interactions moved from reactive issue resolution to proactive conversations — discussing product capabilities, exploring advanced features like MCP access, and helping the team get more value from the platform over time.
A partnership, not just a helpdesk
The support relationship evolved into a genuine partnership — with direct, multi-channel access to the KwickMetrics team. The customer's feature requests were not just logged but prioritised and delivered, reinforcing that the platform grows alongside the businesses it serves.
07 Customer Advocacy
A platform they trust — and recommend
After more than a year of near-daily usage, this apparel seller continues to rely on KwickMetrics to monitor performance across Amazon and Walmart. Their confidence in the platform extends beyond their own operations, with at least three referrals to other sellers.
Managing multiple marketplaces requires more than tracking sales. We need a clear view of profitability across every channel to make informed business decisions. KwickMetrics has become part of our daily workflow.
Customer Team
Multi-marketplace Apparel Seller
The strongest signal of customer trust is continued adoption. With consistent platform usage and multiple unsolicited referrals, this relationship reflects the value of having a unified view of marketplace performance as the business grows.
07 Key Takeaways
What this story demonstrates
This customer uses KwickMetrics the way it was designed to be used: as the daily operating dashboard for a multi-marketplace e-commerce business. The team does not log in occasionally to pull a report. They log in nearly every day to run the business.
Key Takeaway
Multi-marketplace sellers need a single view of profit across all channels. Without it, the highest-margin channel stays hidden behind marketplace-specific reports that never talk to each other.
This apparel seller discovered that Walmart delivers nearly twice the profit margin of Amazon — a finding that is invisible without a unified P&L view across marketplaces.
- Near-daily usage for 12+ months — not a reporting tool, an operating system. 22–29 active days per month, consistently.
- Product Trends and Dashboard are the daily drivers — 765 combined pageviews in 6 months. The team checks performance daily.
- Walmart is the higher-margin channel at 25.1% vs Amazon's 14.4% — visible only because both P&Ls live in one place.
- Feature requests signal investment: 15+ feature requests mean the customer knows what else the platform should do — because they use it enough to know what is missing.
- Unprompted referrals are the ultimate proof: A customer who sends you new business is one who considers your product essential.
Risks & Improvement Opportunities
Despite the strong engagement, there are areas to address:
- Amazon Ads integration is not connected. With significant monthly ad spend on Amazon, connecting Amazon Ads data would unlock TACoS-level profit visibility — the very metric this customer has requested multiple times.
- Usage dipped slightly in Aug–Sep 2026 (21–22 active days vs 25–29 earlier). Worth monitoring for churn risk, though the absolute level remains high.
- Plan upgrade opportunity: Given the scale ($3.1M revenue, 5 marketplaces, 1,800 SKUs), an upgrade conversation would unlock additional features the customer is already requesting.
- Single-user adoption: The Data shows one primary user. For a business of this scale, expanding to multiple team members would deepen organizational dependency on the platform.
See what your real profit looks like after every fee
Connect an Amazon or Walmart account and watch every SKU's true profit line up — revenue, fees, returns, ad cost, and what you actually keep.
Connect an Account Free →