01 Client Overview
The client at a glance
Multi-Brand Portfolio Manager
Category: Brand Aggregator
Marketplace: Walmart US
Account Type: Multi-Seller Portfolio
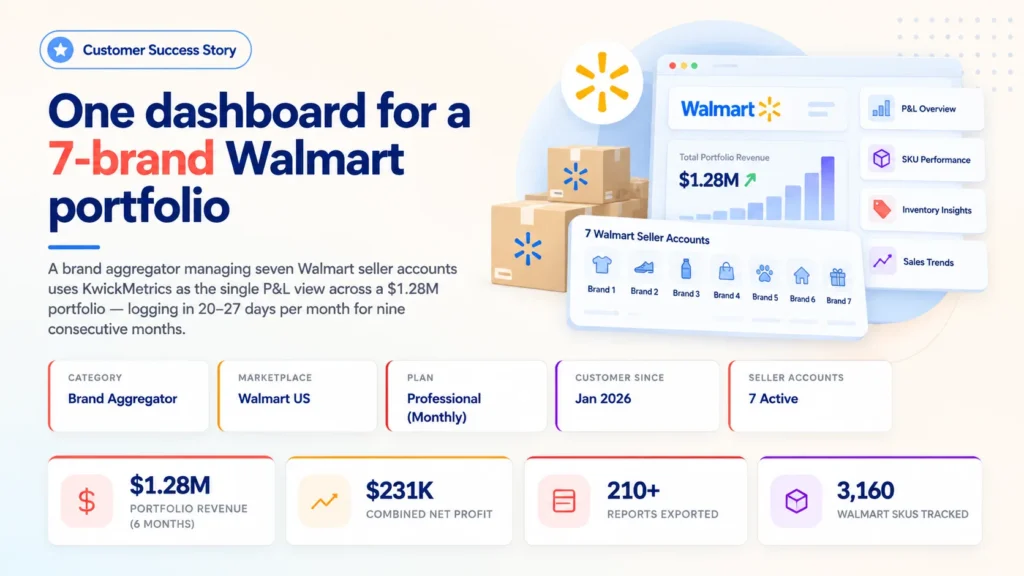
This customer is a brand aggregator — a company that acquires, operates, and scales multiple e-commerce brands under a single management umbrella. The portfolio includes seven active Walmart seller accounts across categories including pet supplies, home goods, personal care, and consumer electronics, with over 3,160 tracked SKUs.
The business has been a KwickMetrics subscriber since January 2026 on a Professional monthly plan. Unlike single-brand sellers, the core use case here is portfolio-level oversight: seeing the P&L across every brand in one place, exporting financial data for internal reporting, and monitoring which brands are scaling and which need attention.
02 The Challenge
Seven brands, one spreadsheet problem
Managing a portfolio of Walmart brands means managing seven separate Seller Center logins, seven sets of settlement reports, seven P&L spreadsheets, and seven sets of fee reconciliations — every month. The core challenge was operational visibility at the portfolio level.
"We needed a single view of profitability across every brand — after every Walmart fee, return, and ad cost — without assembling seven separate spreadsheets every month."
The support ticket history reveals the specific needs that drove adoption:
- Portfolio-level P&L: A single view of net profit across all brands, after every Walmart fee, WFS cost, and return — not just revenue.
- Fee accuracy: Walmart's fee structures (inbound fees, transfer fees, WFS fulfillment) needed to be captured completely and reconciled against settlement reports.
- COGS management at scale: Bulk uploading cost-of-goods across thousands of SKUs and ensuring they reflect correctly in the P&L for each brand.
- Exportable financial data: The team needed to pull sales order data out of KwickMetrics to feed internal financial workflows and reporting systems.
- Multi-brand onboarding speed: Connecting seven seller accounts and loading historical data needed to happen quickly so the team could start making decisions from day one.
03 Adoption Journey
From first login to portfolio command centre
The customer signed up in January 2026 and connected seven Walmart seller accounts. Within the first week, they were already querying data accuracy — a sign that the platform was immediately integrated into their financial workflow.
January 2026 — Rapid onboarding
Account created January 8. Seven Walmart seller accounts connected. COGS bulk upload initiated immediately. By the second day, the team was already cross-referencing KwickMetrics data with internal financials — a sign the platform was instantly embedded in their workflow. Data shows 20 active days in the first month.
February–March 2026 — P&L deep dive and team onboarding
The team onboarded additional users and began deep-diving into Walmart fee structures — leveraging the P&L view to understand WFS inbound and transfer costs at the brand level. COGS were finalised across the entire portfolio. Active usage remained at 20 days per month.
April–June 2026 — Settled into daily operations
Usage increased to 22–25 active days per month. The multi-account sales dashboard became the primary entry point. Report exports ramped up significantly — the team began feeding KwickMetrics data into their internal financial reporting systems.
July–September 2026 — Portfolio expansion
Two additional brand accounts onboarded (including a new pet supply brand). Usage peaked at 27 active days in July. Walmart Ads integration leveraged across active brands. The team is now actively customising dashboard layouts to suit their portfolio view.
04 Product Usage & Adoption
What they use and how often
The data shows consistent near-daily usage since January 2026. The usage pattern is distinct from single-brand sellers: the multi-account dashboard and sales order exports dominate, reflecting a portfolio-management use case.
Most-Used Features
| Feature | Usage Pattern |
|---|---|
| Multi-Account Dashboard | Primary entry point — portfolio-wide sales overview across all brands every day |
| Sales Order Exports | Heavy usage across all brands — feeding internal financial reporting and reconciliation workflows |
| Dashboard Customisation | Over 200 layout saves — the team tailors views to their specific portfolio monitoring needs |
| Sales Order Reports | Per-brand sales order detail — used for order-level financial analysis |
| Profit & Loss | Periodic deep dives into brand-level profitability — especially around fee reconciliation |
| Products & COGS | COGS management and product-level cost tracking across the portfolio |
Export-heavy workflow
With 210+ report exports in 9 months, this is one of the heaviest export users on the platform. The data does not stay in KwickMetrics — it feeds the aggregator's internal financial systems. KwickMetrics acts as the data extraction layer between Walmart's seller APIs and the company's own reporting infrastructure.
05 Results & Outcomes
Portfolio performance tracked in KwickMetrics
Portfolio Summary — Trailing 6 Months (Apr–Sep 2026)
Portfolio Revenue
$1.28M
Net Profit
$230.8K
Total Orders
57,874
Active Brands
7
Brand-Level Performance Breakdown
| Brand | Revenue | Net Profit | Margin | Orders | YoY Growth |
|---|---|---|---|---|---|
| Brand A (Home Goods) | $600,949 | $93,624 | 16.0% | 28,042 | +202% |
| Brand B (Pet Supplies) | $344,755 | $42,366 | 12.5% | 17,347 | +206% |
| Brand C (Pet Supplies) | $123,063 | $54,529 | 45.7% | 6,545 | New |
| Brand D (Fitness) | $84,986 | $11,895 | 14.7% | 3,283 | +2,962% |
| Brand E (Water Filtration) | $61,871 | $7,853 | 13.9% | 944 | +334% |
| Brand F (Bathroom) | $39,481 | $12,749 | 34.6% | 954 | +162% |
| Brand G (Beauty Tech) | $23,954 | $7,747 | 34.5% | 759 | +2,455% |
Note: Three additional low-volume accounts (under $5K combined) are excluded. YoY growth compares trailing 6 months vs prior-year same period where data is available. Brand C was onboarded mid-2026.
Before vs After KwickMetrics
KwickMetrics holds historical data from before the customer connected their accounts in January 2026, enabling a comparison between the 6 months prior and the most recent 6 months.
Prior 6 Months (Apr–Sep 2025)
Portfolio Revenue$344,879
Portfolio Net Profit$86,179
Total Orders15,576
Active Brands6
With KwickMetrics (Apr–Sep 2026)
Portfolio Revenue$1,279,059
Portfolio Net Profit$230,763
Total Orders57,874
Active Brands7
| Metric | Prior 6 Months | With KwickMetrics | Change |
|---|---|---|---|
| Portfolio Revenue | $344,879 | $1,279,059 | +271% |
| Portfolio Net Profit | $86,179 | $230,763 | +168% |
| Total Orders | 15,576 | 57,874 | +272% |
| Active Brands | 6 | 7 | +1 brand |
Walmart Ads Performance (Top Two Brands)
| Metric | Brand A (Home Goods) | Brand B (Pet Supplies) |
|---|---|---|
| Ad Spend | $62,199 | $75,032 |
| PPC Sales | $369,109 | $195,347 |
| ACoS | 16.9% | 38.4% |
| ROAS | 5.93 | 2.60 |
| TACoS | 10.4% | 21.8% |
| CVR | 17.2% | 18.6% |
The portfolio's two largest advertisers show distinct efficiency profiles — Brand A runs at a strong 5.93 ROAS and 10.4% TACoS, while Brand B invests more aggressively at a 2.60 ROAS to drive market share growth. Having both profiles visible side by side is exactly the kind of cross-brand ad comparison that helps a portfolio manager allocate budget where it delivers the highest return.
Note: The "Before" period uses KwickMetrics' historical data. The comparison shows two non-adjacent windows and is not a controlled experiment. The aggregator's own acquisition, scaling, and operational decisions drove the growth; KwickMetrics provided the cross-brand financial visibility that informed those decisions.
Customer Testimonial
One view across every brand
KwickMetrics helps us monitor sales, profitability, and advertising performance across our Walmart brands in one place.
Customer Team
Multi-Brand Portfolio Manager
06 Support & Engagement
Responsive support, features delivered
Throughout the customer journey, the KwickMetrics support team maintained a fast, hands-on engagement — helping the aggregator get seven brands live, resolve integration queries, and continuously refine their portfolio-level reporting.
- Quick resolution on COGS and data sync: When the team bulk-uploaded cost-of-goods across thousands of SKUs and needed help ensuring the data flowed through to the P&L, the support team resolved each issue promptly — keeping the financial pipeline intact.
- Walmart fee coverage expanded: Based on customer feedback, the team expanded Walmart fee mapping to include WFS inbound and transfer fees — improving P&L accuracy for the entire Walmart seller base.
- Seamless multi-account expansion: As new brands were acquired and onboarded, integration and setup were handled quickly, ensuring each new brand appeared in the portfolio view without disrupting existing operations.
- Customer feedback shaped the product: Detailed input from this customer on Walmart fee structures directly contributed to improving KwickMetrics' Walmart P&L coverage for all users — a partnership that benefits the entire platform.
A partnership that improves the platform
Multi-brand customers like this aggregator stress-test the platform in ways single-brand sellers do not. The feedback loop — detailed questions about fee structures, settlement reconciliation, and cross-brand reporting — has directly improved KwickMetrics' Walmart analytics for every customer on the platform.
07 Key Takeaways
What this story demonstrates
This customer represents a distinct KwickMetrics use case: the brand aggregator. Unlike single-brand sellers who need SKU-level profit visibility, a portfolio manager needs brand-level financial oversight — which brands are scaling, which are profitable, where to allocate capital, and whether the combined P&L makes sense.
Key Takeaway
Brand aggregators need a portfolio-level P&L view. Without it, every brand is a separate spreadsheet, and the portfolio-level picture — which brand to scale, which to fix, which to exit — stays buried.
This aggregator went from managing seven separate Walmart Seller Center logins to a single dashboard that shows revenue, profit, orders, and ad efficiency across the entire portfolio.
- Daily usage for 9 consecutive months — the platform is embedded in the operational workflow, not used for occasional reporting.
- 210+ exports mean the data feeds internal systems — KwickMetrics is the data extraction layer between Walmart's seller APIs and the aggregator's own financial infrastructure.
- Cross-brand ad comparison drives smarter decisions: One brand runs at 5.93 ROAS, another at 2.60. That contrast — visible only in a unified view — tells the portfolio manager exactly where to shift ad budget.
- Portfolio-level P&L replaces seven spreadsheets: Revenue, profit, orders, and ad efficiency across the entire portfolio in one dashboard — the aggregator's single source of truth.
See what your real profit looks like after every fee
Connect an Amazon or Walmart account and watch every SKU's true profit line up — revenue, fees, returns, ad cost, and what you actually keep.
Connect an Account Free →