01 Client Overview
The client at a glance
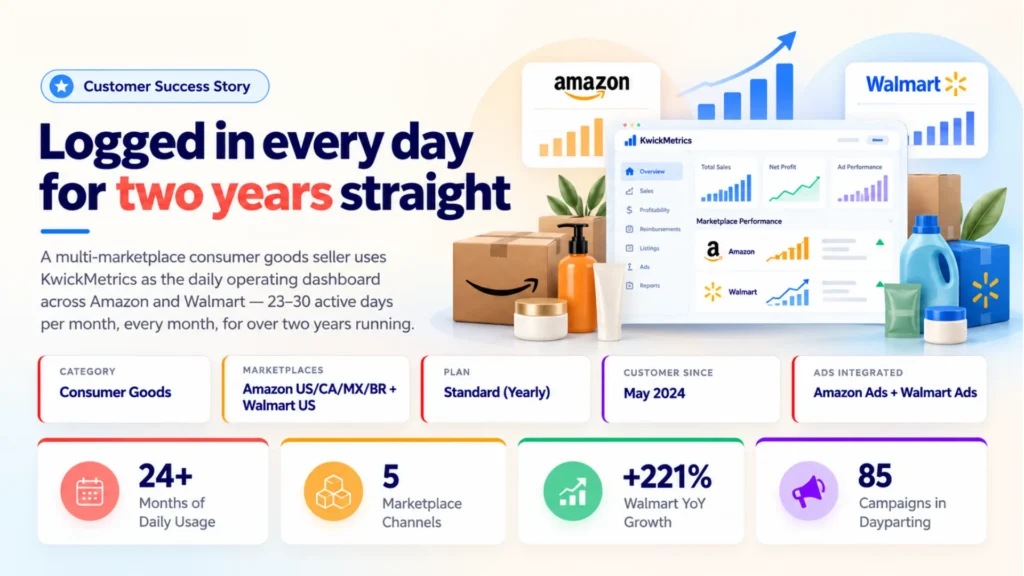
Multi-Marketplace Consumer Goods Seller
Category: Consumer Goods
Marketplaces: Amazon US, CA, MX, BR + Walmart US
Account Type: Multi-Brand Seller
This customer operates a multi-brand consumer goods business across five marketplace channels — Amazon US, Canada, Mexico, Brazil, and Walmart US. The business manages three distinct seller brands through KwickMetrics, with both Amazon Ads and Walmart Ads fully integrated for complete advertising visibility.
A KwickMetrics subscriber since May 2024 on a Standard yearly plan, this is one of the platform's longest-tenured daily users. The business treats KwickMetrics not as a reporting tool but as the operational dashboard that opens every morning.
02 The Challenge
Five marketplaces, three brands, one view needed
Running a consumer goods business across Amazon's four North American regions, Brazil, and Walmart US means managing multiple seller accounts, multiple ad platforms, and multiple fee structures. The core challenge was bringing all of that into a single operational view.
"We needed one dashboard to see what was really happening across every marketplace and every brand — not five separate Seller Central logins and a spreadsheet to stitch them together."
- Cross-marketplace profitability: Understanding true profit after marketplace-specific fees, FBA costs, ad spend, and returns across Amazon US, CA, MX, BR, and Walmart.
- Ad spend optimisation across time zones: Managing PPC campaigns across multiple time zones and marketplaces, with no way to automate bid adjustments by hour of day.
- Multi-brand oversight: Three separate seller brands needed a unified view — each with their own products, COGS, fees, and P&L.
- MCF order tracking: Multi-Channel Fulfillment orders needed to be included in the financial view alongside standard FBA and Walmart orders.
- Storage cost visibility: Understanding FBA storage fees and their impact on per-SKU profitability across seasonal demand cycles.
03 Adoption Journey
From first login to daily operating system — for two years
The customer signed up in May 2024. Within five months, the platform was embedded in the daily workflow. Over the next two years, usage never dropped — averaging 26 active days per month across 24 consecutive months.
May–Sep 2024 — Onboarding and integration
Account created and Amazon marketplaces connected. The team began using the dashboard for daily sales monitoring. COGS were uploaded across brands. By October the platform was already part of the daily routine.
Oct 2024–Mar 2025 — Deep P&L adoption
Active days climbed to 26–30 per month. The team dove deep into P&L analysis, storage fee breakdown, and expense tracking. Feature requests for MCF order integration and prime/non-prime estimation were submitted — signs of a power user pushing the platform's capabilities.
Apr–Dec 2025 — Multi-marketplace maturity
Usage remained steady at 25–29 days per month. The team refined their financial tracking, leveraged promotional expense analysis, and deepened their understanding of per-SKU profitability across regions. Amazon Ads and Walmart Ads data fully integrated.
Jan–Oct 2026 — Advanced automation and AI
Dayparting deployed across 85 campaigns with 836 targets — automating bid management by hour of day. MCP access activated. P&L Version 2 adopted for transaction-level profit tracking. AI-powered analytics features explored. Usage peaked at 29 active days in August 2026.
04 Product Usage & Adoption
What they use and how often
The data across 24 months reveals one of the most consistent usage patterns on the platform — near-daily engagement that has never faded since onboarding.
Most-Used Features
| Feature | Usage Pattern |
|---|---|
| Dashboard | Primary daily view — the first screen opened every morning to check sales, profit, and orders across all marketplaces |
| Date Range Analysis | Over 1,300 date range changes in 6 months — constant comparison of periods to spot trends and anomalies |
| Dashboard Customisation | 108 layout saves — tailoring the view to show exactly the metrics that matter for multi-brand oversight |
| Profit & Loss | Deep P&L analysis including Version 2 transaction-matched reporting for precise profitability tracking |
| Products & COGS | Per-SKU cost management and product-level performance tracking across brands |
| Dayparting | Automated bid management by hour of day — 85 campaigns, 836 targets under active schedule control |
| AI Analytics | AI-powered recommendations and analysis adopted, with MCP integration for advanced capabilities |
Dayparting at scale
This customer uses KwickMetrics' Dayparting feature to automate bid management across 85 Amazon PPC campaigns with 836 individual targets. The schedule adjusts bids by hour of day to reduce overnight ad waste and concentrate spend during peak conversion hours — a level of automation that replaces hours of manual bid management every week.
05 Results & Outcomes
Performance tracked in KwickMetrics
Primary Brand — Amazon US (Trailing 6 Months)
Revenue
$291K
Orders
8,556
↑ 5.9% YoYUnits
9,386
↑ 5.7% YoYAd Spend Managed
$34.9K
Walmart US — Channel Growth
Revenue
$44.8K
↑ 221% YoYOrders
1,218
↑ 214% YoYUnits
1,311
↑ 220% YoYGrowth Rate
3.2×
Amazon Ads Performance (Trailing 6 Months)
| Metric | Value |
|---|---|
| Impressions | 5.8M |
| Clicks | 60,263 |
| PPC Sales | $96,891 |
| Ad Spend | $34,915 |
| ROAS | 2.78 |
| TACoS | 12.0% |
| CTR | 1.04% |
| CVR | 4.5% |
With $34,915 in managed ad spend generating $96,891 in PPC sales and a 12% TACoS, the business maintains a healthy ratio of paid-to-organic traffic. The Dayparting automation — controlling bids across 85 campaigns by hour — plays a key role in managing ad efficiency at this scale.
How KwickMetrics Supports This Business
- Unified multi-marketplace view: Five Amazon regions and Walmart US in a single dashboard — eliminating the need to log into multiple Seller Central accounts to understand overall business health.
- Automated bid management: Dayparting across 85 campaigns replaces hours of manual bid adjustments, concentrating ad spend during peak conversion hours and reducing overnight waste.
- Walmart channel growth tracking: With Walmart growing 221% YoY, having both marketplaces in one P&L view ensures the team can track where growth is coming from and at what margin.
- Transaction-level P&L: P&L Version 2 provides transaction-matched profitability tracking, giving the team precise visibility into which fees affect which orders.
- Multi-brand management: Three seller brands managed through one platform, each with their own COGS, products, and financial tracking.
Customer Testimonial
One dashboard across every marketplace
KwickMetrics gives us a single view of our business across marketplaces and helps us automate ad management while tracking profitability.
Customer Team
Multi-Marketplace Consumer Goods Seller
06 Support & Engagement
Responsive support, features delivered
Over two years of partnership, the KwickMetrics support team maintained an active, multi-channel relationship — resolving queries quickly and turning customer feedback into shipped product improvements.
- Quick resolution on data and integration queries: When the team had questions about storage fee calculations, P&L breakdowns, or dashboard data, the support team investigated and clarified each issue promptly — maintaining confidence in the numbers.
- Dayparting setup and optimisation support: The support team assisted with dayparting configuration across 85 campaigns, helping the customer set up and refine automated bid schedules for maximum efficiency.
- Feature requests shipped: Customer feedback directly led to MCF order integration, dayparting management improvements, and P&L Version 2 enhancements — a collaboration that benefited all users on the platform.
- Multi-channel engagement: Support interactions spanned WhatsApp, phone, web, and chat — reflecting a high-touch, always-accessible partnership.
Two years of partnership
A customer who stays engaged for over two years and continues to request advanced features is one who considers the platform essential to their operations. This is not a customer who logs in occasionally — this is a customer whose business runs on KwickMetrics every single day.
07 Key Takeaways
What this story demonstrates
This customer represents the deepest kind of product engagement: the daily operating system. Not a tool that gets checked weekly. Not a reporting layer that runs monthly. A dashboard that opens every morning, across every marketplace, for every brand — and has done so for over two years.
Key Takeaway
The most valuable analytics platform is the one your team opens first thing every morning. After 24 months of near-daily usage, KwickMetrics isn't a tool for this business — it's the operating system.
From automated dayparting across 85 campaigns to transaction-level P&L across five marketplace channels, every decision flows through the same dashboard.
- 24 months of near-daily usage — 23–30 active days per month, every single month. This is the definition of an indispensable tool.
- Dayparting automates what used to be manual: 85 campaigns with 836 targets on automated hourly bid schedules — hours of weekly work replaced by a set-and-monitor system.
- Walmart grew 221% while Amazon held steady — the cross-marketplace view shows exactly where growth is happening and where to invest next.
- Feature requests became product features: MCF order integration, dayparting improvements, and P&L enhancements were shipped based on this customer's feedback — a partnership that improves the platform for everyone.
See what your real profit looks like after every fee
Connect an Amazon or Walmart account and watch every SKU's true profit line up — revenue, fees, returns, ad cost, and what you actually keep.
Connect an Account Free →