01 Client Overview
The client at a glance
Global Beauty & Skincare Brand
Category: Beauty & Personal Care
Marketplaces: 11 Amazon EU Markets
Account Type: Global Brand Seller
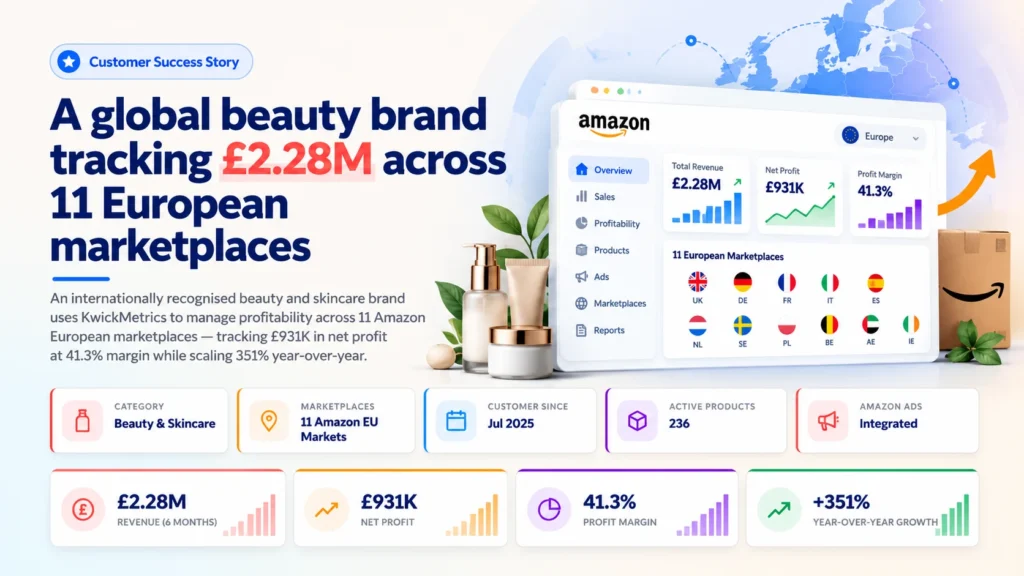
This is an internationally recognised beauty and skincare brand — a name known in high streets and shopping centres around the world. The Amazon operation spans 11 European marketplaces, with 563 total products (236 active), Amazon Ads integrated, and a GBP-denominated base currency reflecting the UK as the primary market.
A KwickMetrics subscriber since July 2025, the brand uses the platform to track profitability across their pan-European Amazon presence — with particular focus on the UK market, which generates the majority of volume. The scale of this account — 132,547 orders and £2.28M in revenue over six months — makes it one of the largest sellers using KwickMetrics.
02 The Challenge
Pan-European profitability at global brand scale
Selling across 11 Amazon European marketplaces means managing 11 different fee structures, multiple currencies, VAT regimes, FBA cost bases, and advertising platforms. For a global brand, the challenge isn't visibility into revenue — it's visibility into what you actually keep.
"Revenue is easy to see in Seller Central. What's hard is understanding the true profit after every Amazon fee, every VAT adjustment, and every ad cost — across 11 countries."
- Multi-currency P&L: Sales in GBP, EUR, SEK, PLN, and AED all need to roll up into a single P&L view with consistent profit calculation.
- VAT complexity: European VAT handling differs by country and needs to be reflected accurately in the P&L — the finance team requires ex-VAT profit visibility.
- Amazon Ads at scale: With significant monthly ad spend across European markets, understanding the true impact of advertising on profitability — not just ACoS — requires integrated ads + P&L data.
- Category and product performance: With 236 active products across beauty and skincare, the team needs to identify which product lines drive margin and which consume it.
- Geographic performance: Understanding which of the 11 marketplaces delivers profitable growth and which operates at insufficient scale.
03 Adoption Journey
From onboarding to pan-European oversight
The brand signed up in July 2025 and connected 11 Amazon European marketplaces. The team began using KwickMetrics for P&L analysis during a period of rapid growth — scaling from £50K to £2.28M in Amazon UK revenue.
July–September 2025 — Setup and exploration
All 11 European Amazon marketplaces connected. Amazon Ads integrated. The team began exploring the dashboard and P&L views, with usage concentrated in the UK marketplace data where volume was highest.
October 2025–March 2026 — P&L and VAT analysis
The team engaged with support to understand VAT handling in the P&L — a critical requirement for a UK-based brand selling across Europe. Revenue mismatch queries were raised and resolved, building confidence in the financial data.
April–June 2026 — Scaling and team expansion
A second team member was onboarded. The team focused on category reports, top-performing product exports, and geographic performance analysis — using KwickMetrics to understand which markets and products drive the most margin during rapid growth.
July–October 2026 — Mature operations
With Amazon UK revenue at £2.28M and profit at £931K, KwickMetrics serves as the profitability layer for the brand's Amazon business. AI-powered analytics adopted for trend analysis across the portfolio. Configuration centre used for P&L customisation.
04 Product Usage & Adoption
What they use and how often
For a global brand, KwickMetrics serves a specific strategic role: the profitability analysis layer that sits above Seller Central. The usage pattern reflects this — focused, P&L-centric sessions aimed at understanding margin rather than daily operational monitoring.
Most-Used Features
| Feature | Usage Pattern |
|---|---|
| Profit & Loss | Core feature — the most-visited page, used for cross-marketplace profitability analysis and margin tracking |
| Dashboard | Portfolio-level overview — checking sales, orders, and profit across all 11 European marketplaces |
| Category Reports | Product category performance — identifying which beauty and skincare lines drive the highest margin |
| Top Performing Products | Export-driven analysis — pulling top performer data for internal reporting and product strategy |
| Sales Order Reports | Order-level detail — drilling into transaction data for specific markets |
| Geographic Reports | Market-level analysis — understanding performance differences across European regions |
Enterprise P&L for a global brand
When a globally recognised beauty brand chooses KwickMetrics for profitability analysis, it validates the platform's ability to handle enterprise-scale complexity: 11 marketplaces, 5 currencies, multi-country VAT, hundreds of SKUs, and significant advertising spend — all rolled into one P&L view.
05 Results & Outcomes
Performance tracked in KwickMetrics
Amazon UK — Trailing 6 Months (Apr–Sep 2026)
Revenue
£2.28M
Net Profit
£931.5K
Profit Margin
41.3%
Orders
132,547
Before vs After KwickMetrics
KwickMetrics holds historical data from before the brand's signup in July 2025, showing the scale of growth during the period tracked on the platform.
Before KwickMetrics (Jan–Jul 2025)
Revenue£49,955
Net Profit£24,674
Profit Margin49.8%
Orders2,767
Units3,173
With KwickMetrics (Apr–Sep 2026)
Revenue£2,281,810
Net Profit£931,507
Profit Margin41.3%
Orders132,547
Units153,199
| Metric | Before KwickMetrics | With KwickMetrics | Change |
|---|---|---|---|
| Revenue (Amazon UK) | £49,955 | £2,281,810 | +4,468% |
| Net Profit | £24,674 | £931,507 | +3,675% |
| Orders | 2,767 | 132,547 | +4,690% |
| Units Sold | 3,173 | 153,199 | +4,728% |
| Profit Margin | 49.8% | 41.3% | −8.5 pts |
The numbers speak for themselves: £50K to £2.28M in revenue, £25K to £931K in net profit. While the profit margin compressed from 49.8% to 41.3% as the brand scaled — a natural effect of higher ad spend and marketplace fees at volume — the absolute profit grew by 3,675%. KwickMetrics provided the cross-marketplace profitability visibility that supported confident decision-making during this extraordinary growth phase.
Margin protection during rapid scaling
Scaling 45× in revenue while keeping profit margin above 41% is not accidental. It requires seeing exactly where margin is leaking — which products, which markets, which fee categories. KwickMetrics' P&L view gave the brand the per-SKU, per-market visibility to scale aggressively while protecting profitability.
Note: The "Before" period (Jan–Jul 2025) uses KwickMetrics' historical data imported at account connection. Business decisions, market conditions, brand strategy, and advertising investment drove the growth; KwickMetrics provided the financial visibility that informed those decisions.
Customer Testimonial
Know your true profit across every market
KwickMetrics brings our sales, Amazon fees, VAT, and advertising costs into one P&L view across 11 European marketplaces, helping us identify profitable products and scale with confidence.
Customer Team
Global Beauty & Skincare Brand
06 Support & Engagement
Responsive support, features delivered
The KwickMetrics support team provided focused, efficient assistance on the specific needs of a European brand — particularly around VAT handling and multi-currency P&L accuracy.
- VAT configuration guidance: The team helped configure P&L reporting to handle UK VAT requirements — ensuring the finance team could see profit figures on an ex-VAT basis, critical for accurate margin analysis.
- Quick resolution on data queries: When the team identified revenue differences between reports, the support team investigated and clarified the discrepancy — building confidence in the financial data the brand relies on.
- Feature discovery support: Questions about Buy Box percentage and product performance features were answered promptly, helping the team discover and use capabilities they needed for competitive analysis.
- Multi-user onboarding: A second team member was onboarded with guidance, expanding the platform's reach within the organisation.
Enterprise-grade support for a global brand
When a brand of this stature chooses a platform, support quality is a non-negotiable. The focused, efficient engagement — answering VAT questions, resolving data queries, guiding feature discovery — met the standard expected by a global enterprise team.
07 Key Takeaways
What this story demonstrates
This case study proves that KwickMetrics scales to global brand operations. When an internationally recognised beauty brand — selling across 11 European Amazon marketplaces — chooses KwickMetrics for P&L analysis, it validates the platform's ability to handle enterprise complexity.
Key Takeaway
A business that scales 45× in revenue while keeping profit margin above 41% isn't guessing. They're measuring — every fee, every return, every ad cost, across every market.
KwickMetrics provided the cross-marketplace P&L visibility that let this brand scale from £50K to £2.28M on Amazon while protecting profitability throughout.
- £931K net profit at 41.3% margin — scaling 45× in revenue while maintaining margins above 40% requires per-SKU, per-market profit visibility. That's what KwickMetrics delivers.
- 11 European marketplaces in one P&L — five currencies, multiple VAT regimes, and 11 different Amazon fee structures rolled into a single profitability view.
- Global brand validation: When a household-name beauty brand chooses KwickMetrics over enterprise alternatives, it signals that the platform delivers at the highest level of operational complexity.
- P&L is the anchor feature: This brand's most-visited page is the Profit & Loss view — they use KwickMetrics to understand what they keep, not just what they sell.
See what your real profit looks like after every fee
Connect an Amazon or Walmart account and watch every SKU's true profit line up — revenue, fees, returns, ad cost, and what you actually keep.
Connect an Account Free →