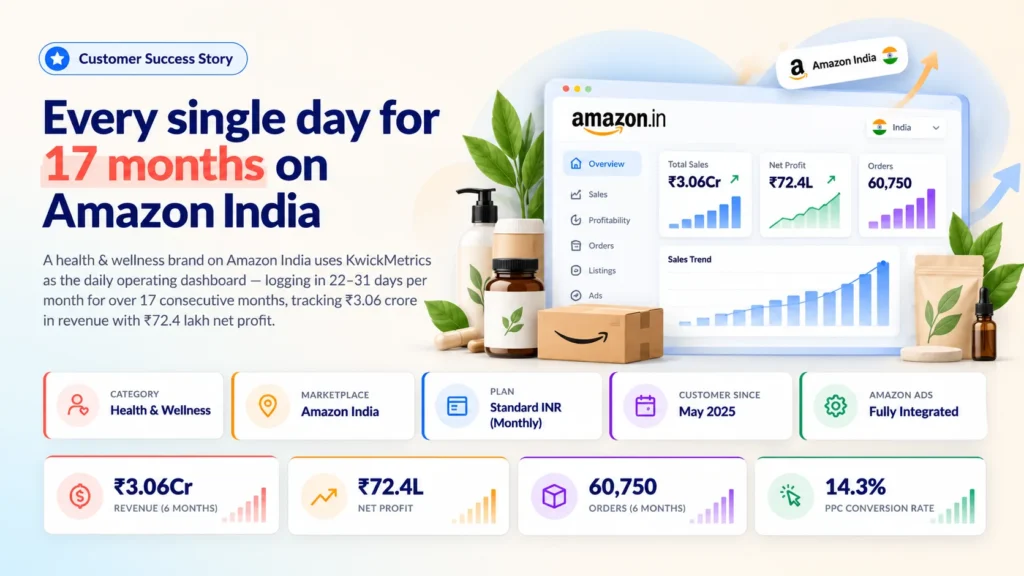
01 Client Overview
The client at a glance
Amazon India Health & Wellness Brand
Category: Health Supplements & Nutraceuticals
Marketplace: Amazon India
Account Type: Brand Seller
This is a growing health and wellness brand on Amazon India — selling nutraceutical products including collagen peptides, biotin supplements, and plant-based health formulations. With 93 active products from a catalogue of 233, the business generates over 60,000 orders every six months while maintaining a 25% profit margin.
A KwickMetrics subscriber since May 2025 on the Standard INR plan, this seller uses the platform as the daily command centre for sales, profit, and advertising performance. With Amazon Ads fully integrated and ₹38 lakh in PPC spend under active management, this is a business that relies on data-driven decisions every single day.
02 The Challenge
Scaling profitably in India's most competitive category
Health and wellness is one of Amazon India's fastest-growing and most competitive categories. Scaling from thousands to tens of thousands of orders per month — while maintaining margin — requires daily visibility into what every sale actually costs after Amazon fees, advertising, and returns.
"In the health supplements category, Amazon fees and ad costs can eat your margin overnight. You need to see profit by SKU, every day, or you're flying blind."
- Per-SKU profitability across 93 products: Understanding which supplement lines deliver margin and which consume it — after Amazon referral fees, FBA charges, and advertising costs.
- Amazon Ads efficiency at scale: Managing ₹38 lakh in PPC spend across a large product catalogue while maintaining a sustainable TACoS and ensuring paid traffic converts profitably.
- Tax and fee complexity: Amazon India's fee structure — including GST, referral fees, and FBA charges — creates layers of cost that need to be accurately captured in the P&L.
- Reimbursement recovery: At 60,000+ orders per six months, FBA inventory losses and customer return discrepancies create reimbursement opportunities that need to be identified and claimed.
- Scaling without margin erosion: Growing 78% in revenue while preventing the margin compression that typically accompanies aggressive scaling in competitive categories.
03 Adoption Journey
Day one to daily habit — in three days
The customer signed up in May 2025. Within three days, they were logging in daily. Within one month, they were at 30 active days. This level of immediate adoption never faded — 17 months later, the pattern holds.
May–July 2025 — Instant adoption
Account created May 29. By June, it records 30 active days — every single day of the month. The team immediately began using the dashboard for daily sales monitoring and P&L for profitability analysis. A KwickMetrics team member provided hands-on onboarding support.
August–December 2025 — Deep engagement
Usage remained at 29–31 active days per month. The team explored reimbursement tracking features, submitted a feature request for AI-powered ads automation, and deepened their P&L analysis. Amazon Ads integration provided full visibility into PPC spend and profitability.
January–May 2026 — Advanced features and scaling
Active days held at 22–31 per month. The team explored Ruleset creation for bid automation, used the financial dashboard for deeper analysis, and began exporting data for internal reporting. Revenue grew to ₹3.06 crore during this period.
June–October 2026 — MCP and AI adoption
MCP integration explored. A dedicated demo was provided covering advanced KwickMetrics tools. AI-powered analytics adopted with 69+ AI events. The team actively explored the prompt library for AI-assisted analysis of their business data.
04 Product Usage & Adoption
What they use and how often
The data across 17 months shows one of the deepest daily-usage patterns on the platform. The dashboard is the morning ritual — opened every day to check performance across the entire product catalogue.
Most-Used Features
| Feature | Usage Pattern |
|---|---|
| Dashboard | The daily starting point — 282 pageviews in 6 months, opened every morning to check sales, orders, and profit |
| Profit & Loss | Deep profitability analysis — understanding true margin after Amazon fees, ad costs, and taxes |
| Date Range Analysis | Over 300 date-range changes — constant period comparisons to spot trends and seasonal patterns |
| PPC Reports & Exports | Regular advertising performance review and data export for campaign optimisation |
| Financial Dashboard | Advanced financial overview for deeper revenue and cost breakdowns |
| Reimbursement Tracking | Active use of reimbursement features to identify and recover FBA inventory losses |
| Products & COGS | Per-SKU deep dives — checking individual supplement performance at the product level |
| MCP & AI Analytics | Advanced AI features explored including MCP prompt library for AI-assisted business analysis |
Reimbursement recovery — money left on the table
At 60,000+ orders per six months, FBA inventory losses and return discrepancies add up. This customer actively uses KwickMetrics' reimbursement tracking to identify unclaimed funds — money that would otherwise remain unrecovered in Amazon's system. Multiple support interactions confirm this is a valued, regularly used feature.
05 Results & Outcomes
Performance tracked in KwickMetrics
Amazon India — Trailing 6 Months (Apr–Sep 2026)
Revenue
₹3.06Cr
Net Profit
₹72.4L
↑ 7.2% YoYProfit Margin
25.1%
Orders
60,750
↑ 25.6% YoYBefore vs After KwickMetrics
KwickMetrics holds historical data from before the customer's signup in May 2025, enabling a direct comparison of business performance.
Before KwickMetrics (Nov 2024–May 2025)
Revenue₹1.72Cr
Net Profit₹58.5L
Profit Margin36.1%
Orders37,517
With KwickMetrics (Apr–Sep 2026)
Revenue₹3.06Cr
Net Profit₹72.4L
Profit Margin25.1%
Orders60,750
| Metric | Before KwickMetrics | With KwickMetrics | Change |
|---|---|---|---|
| Revenue | ₹1.72 Crore | ₹3.06 Crore | +78% |
| Net Profit | ₹58.5 Lakh | ₹72.4 Lakh | +24% |
| Orders | 37,517 | 60,750 | +62% |
| Units Sold | 41,149 | 71,024 | +73% |
Revenue grew 78% and absolute profit grew 24% from the pre-KwickMetrics period. KwickMetrics provided the daily per-SKU profitability visibility that enabled confident scaling — knowing exactly which products and ad campaigns were contributing to margin during aggressive growth.
Amazon Ads Performance (Trailing 6 Months)
Ad Spend
₹38.0L
PPC Sales
₹1.04Cr
TACoS
12.4%
CVR
14.3%
With ₹38 lakh in ad spend generating ₹1.04 crore in PPC sales and a 12.4% TACoS, the business maintains a healthy balance between paid and organic traffic. The 14.3% conversion rate — well above the Amazon India average for health supplements — reflects strong listing quality and product-market fit, visible through KwickMetrics' integrated ads + profit view.
Note: The "Before" period uses KwickMetrics' historical data. Business decisions, product launches, and advertising strategy drove the growth; KwickMetrics provided the daily financial visibility that informed those decisions.
Customer Testimonial
Make every sale count
KwickMetrics helps us understand our true product-level profitability after fees, returns, and ad spend, so we can identify what’s working and make smarter decisions for our business.
Customer Team
Health & Wellness Seller
06 Support & Engagement
Responsive support, features delivered
Over 17 months, the KwickMetrics support team maintained an active partnership — providing hands-on demos, answering feature questions, and helping the team get maximum value from the platform.
- Dedicated product demos delivered: The KwickMetrics team provided personalised demos covering advanced tools and MCP capabilities — ensuring the customer could leverage the platform's full potential.
- Reimbursement feature guidance: Support helped the team understand and use reimbursement tracking to identify unclaimed FBA funds — turning a support interaction into recovered revenue.
- Tax and P&L queries resolved: Questions about referral fee inclusion and tax data in the P&L were investigated and clarified — critical for accurate margin analysis in the Amazon India context.
- Feature requests acknowledged: The customer's request for AI-powered ads automation was logged — demonstrating a forward-thinking seller who sees the platform as a growth partner, not just a reporting tool.
From customer to product partner
This customer doesn't just use KwickMetrics — they contribute to its roadmap. The feature request for AI-powered ads automation reflects a seller who sees the platform's potential and wants to grow alongside it. That kind of engagement transforms a customer relationship into a product partnership.
07 Key Takeaways
What this story demonstrates
This case study proves that KwickMetrics delivers value for Amazon India sellers at scale. In a category where margins are under constant pressure from competition and advertising costs, daily visibility into per-SKU profitability isn't optional — it's the difference between scaling profitably and scaling into losses.
Key Takeaway
In health & wellness, margins can disappear overnight. A seller who logs in every day to check profit — not just revenue — is one who scales with confidence, not guesswork.
₹1.72 crore to ₹3.06 crore in revenue, with absolute profit growing 24% — made possible by the daily P&L visibility that KwickMetrics provides.
- 17 months of near-daily usage — 22–31 active days per month, every month. When a seller opens your platform every morning, you've become the operating system.
- 78% revenue growth with profit protected — scaling aggressively while keeping absolute profit growing requires seeing exactly where margin lives and where it leaks.
- 14.3% PPC conversion rate at 12.4% TACoS — a healthy ads profile visible through the integrated ads + profit view, ensuring ad spend adds to the margin rather than eroding it.
- Reimbursement recovery in active use — at 60,000+ orders, unclaimed FBA funds add up. Identifying and recovering them is real money returned to the bottom line.
See what your real profit looks like after every fee
Connect an Amazon or Walmart account and watch every SKU's true profit line up — revenue, fees, returns, ad cost, and what you actually keep.
Connect an Account Free →