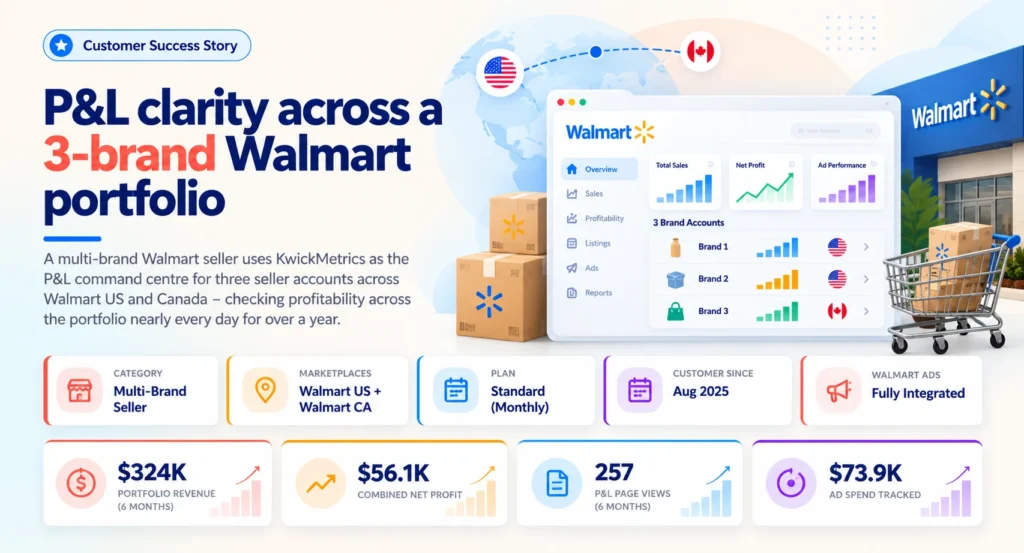
01 Client Overview
The client at a glance
Multi-Brand Walmart Seller
Category: Consumer Products
Marketplaces: Walmart US + Walmart CA
Account Type: Multi-Brand Portfolio
This customer operates three Walmart seller brands across the US and Canadian marketplaces, with 269 tracked SKUs and Walmart Ads fully integrated across all accounts. A KwickMetrics subscriber since August 2025, the business uses the platform primarily as a P&L analysis tool — understanding exactly what they keep after every Walmart fee, ad cost, and return across all three brands.
What makes this customer distinctive is the depth of their P&L engagement. While many sellers use KwickMetrics for the dashboard overview, this team spends the majority of their time in the Profit & Loss view — drilling into brand-level profitability with an intensity that reflects a business driven by margin analysis, not just revenue tracking.
02 The Challenge
Three brands, two marketplaces, zero profit visibility
Running three Walmart seller accounts across the US and Canada creates a financial visibility challenge that Walmart's native Seller Center cannot solve on its own. The team needed to answer one question across every brand: after every fee, ad cost, and return — what did we actually keep?
"We run three brands on Walmart. Without a single P&L view across all of them, we were making decisions brand-by-brand with no portfolio-level picture."
- Cross-brand P&L visibility: Understanding true profitability after all Walmart fees — WFS fulfillment, storage, commission, and ad costs — across three separate seller accounts.
- Walmart Ads efficiency tracking: With $73.9K in combined ad spend across brands, the team needed to see which brand's ad investment was driving profitable growth and which was burning budget.
- Walmart Canada expansion: Adding a new marketplace meant a new fee structure, a new currency, and a new set of financial data to track — all needing to fold into the existing portfolio view.
- Walmart fee settlement clarity: Understanding exactly how Walmart fees are calculated and settled — and ensuring they are correctly reflected in the P&L — was essential for accurate margin decisions.
03 Adoption Journey
From setup to P&L command centre
The customer signed up in August 2025 and connected their first Walmart seller account. Within one month, they were logging in 24 days and had already filed support queries about Walmart fee structures — a sign that the platform was immediately being used for financial decision-making.
August–October 2025 — Rapid onboarding
Three team members logged in during the first week. The primary user hit 16 active days in the first partial month, then 24 days in September. The Walmart Ads integration was connected, and the team began drilling into P&L and ads analytics immediately.
November 2025–March 2026 — P&L deep adoption
Active days settled at 20–24 per month. The team focused heavily on Walmart fee structures in the P&L view, understanding how WFS fees flow into profitability. Dashboard layouts were customised extensively — over 980 layout saves across this period reflect a team tailoring the platform to their exact needs.
April–June 2026 — Multi-marketplace expansion
Walmart Canada connected for the second brand. New seller account (GS US) onboarded. The team began tracking P&L and PPC across all three brands in both US and Canadian marketplaces — bringing the entire portfolio under one roof.
July–October 2026 — Mature daily operations
Usage peaked at 24–25 active days per month. PPC reporting across all brands became a regular workflow. AI-powered analytics features adopted with 805+ AI events. The platform settled into its role as the daily operating dashboard for all three brands.
04 Product Usage & Adoption
What they use and how often
The data across 14 months reveals a P&L-centric usage pattern. While most sellers start with the dashboard, this customer lives in the Profit & Loss view — checking profitability across brands nearly every day.
Most-Used Features
| Feature | Usage Pattern |
|---|---|
| Profit & Loss | Core daily view — 257 combined pageviews across all three brands, the heaviest P&L usage in the customer base |
| Dashboard | Multi-brand overview — primary account checked daily for portfolio-level sales health |
| PPC Reports | Regular ads review across all brands — tracking spend, ACoS, ROAS, and TACoS by brand |
| Dashboard Customisation | Over 980 layout saves — the most extensive customisation observed, reflecting a team tailoring views to exact needs |
| PPC Dashboard | Ads performance monitoring across all three Walmart Ads accounts for portfolio-level ad visibility |
| AI Analytics | AI-powered recommendations adopted — 805+ AI events in the last 6 months for trend analysis and insights |
P&L-first mindset
With 257 P&L pageviews in 6 months — more than most customers accumulate in a year — this team does not use KwickMetrics to check sales. They use it to check profit. The P&L view is where every fee, cost, and margin is dissected by brand, and it is the most-visited feature across their entire account.
05 Results & Outcomes
Portfolio performance tracked in KwickMetrics
Combined Portfolio — Trailing 6 Months (Apr–Sep 2026)
Portfolio Revenue
$324.5K
Net Profit
$56.1K
Total Orders
16,927
Ad Spend
$73.9K
Brand-Level Performance Breakdown
| Brand | Revenue | Net Profit | Margin | Orders | YoY Growth |
|---|---|---|---|---|---|
| Brand A (US + CA) | $144,476 | $17,390 | 12.6% | 6,634 | +113% |
| Brand B (US + CA) | $122,424 | $16,425 | 13.6% | 8,057 | New |
| Brand C (US) | $57,645 | $22,300 | 39.4% | 2,236 | Established |
Margin comparison reveals the hidden winner
Brand C generates the smallest revenue ($57.6K) but the highest profit margin at 39.4% — nearly 3× the margin of Brands A and B. Without a unified P&L view across all three brands, this insight stays invisible. It's exactly the kind of finding that guides where to invest next: Brand C's margin economics may support aggressive scaling.
Walmart Ads Performance by Brand
| Metric | Brand A | Brand B |
|---|---|---|
| Ad Spend | $35,295 | $38,584 |
| PPC Sales | $74,747 | $75,649 |
| ROAS | 2.12 | 1.96 |
| TACoS | 24.4% | 31.5% |
| CVR | 7.9% | 9.4% |
| PPC Orders | 3,285 | 4,843 |
Both brands invest heavily in Walmart Ads — $73.9K combined in 6 months. Brand B drives more PPC orders (4,843 vs 3,285) and a higher conversion rate (9.4% vs 7.9%), while Brand A achieves better ROAS and TACoS efficiency. This side-by-side comparison — visible only in a unified ads analytics view — enables the team to allocate ad budgets where they deliver the strongest return for each brand.
Customer Testimonial
One P&L view across three brands
We run three brands on Walmart. Without a single P&L view across all of them, we were making decisions brand-by-brand with no portfolio-level picture. KwickMetrics changed that by providing a unified view of revenue, costs, and profitability across all brands, helping us make better data-driven decisions and manage the business as a single portfolio.
Customer Team
Multi-Brand Walmart Seller
06 Support & Engagement
Responsive support, features delivered
Over 14 months, the KwickMetrics support team maintained an active, fast-response partnership — helping with marketplace integrations, Walmart fee structures, and ads analytics across all three brands.
- Quick resolution on Walmart fee questions: When the team needed clarity on how Walmart fees were calculated and reflected in the P&L, the support team investigated and resolved each query — ensuring the numbers the team relies on are accurate.
- Seamless marketplace expansion: When Walmart Canada was added for the second brand, integration setup and data sync were handled smoothly, bringing the new marketplace into the existing portfolio view.
- Ads analytics issues resolved promptly: When ad sales data temporarily stopped reflecting, the support team investigated and restored the data flow — keeping the team's advertising visibility intact.
- Multi-brand onboarding support: Each new seller account was onboarded with guidance, ensuring data appeared correctly across the portfolio from day one.
Team-wide support engagement
Multiple team members engage with the KwickMetrics support team — not just the primary user. This signals that the platform is used across the organisation, not by a single individual, and that the support relationship extends to everyone who relies on the data.
07 Key Takeaways
What this story demonstrates
This customer represents the P&L power user — a seller who doesn't just glance at the dashboard but lives inside the Profit & Loss view, checking margin across every brand, every day. The platform isn't used for sales tracking. It's used for profit tracking.
Key Takeaway
The most profitable brand isn't always the one with the most revenue. Brand C generates the smallest top line but the highest margin at 39.4% — a finding that only surfaces in a unified P&L view across the entire portfolio.
Without KwickMetrics, this team would be making investment decisions based on revenue alone, missing that their highest-margin brand is actually the one generating the least sales.
- 257 P&L views in 6 months — this team doesn't check sales. They check profit. KwickMetrics is their margin analysis tool, not their revenue dashboard.
- 980+ dashboard layout saves — the most extensive customisation in the customer base. The team has shaped the platform to show exactly the metrics they need, the way they need them.
- Brand C's 39.4% margin is the hidden winner — visible only because all three brands' P&Ls live in one platform. Revenue tells one story; margin tells a different one.
- $73.9K in ads tracked across brands — the side-by-side ads comparison shows which brand converts better (Brand B at 9.4% CVR) and which is more ad-efficient (Brand A at 24.4% TACoS).
See what your real profit looks like after every fee
Connect an Amazon or Walmart account and watch every SKU's true profit line up — revenue, fees, returns, ad cost, and what you actually keep.
Connect an Account Free →