Top Q4 mistakes Amazon sellers make and what data should show instead
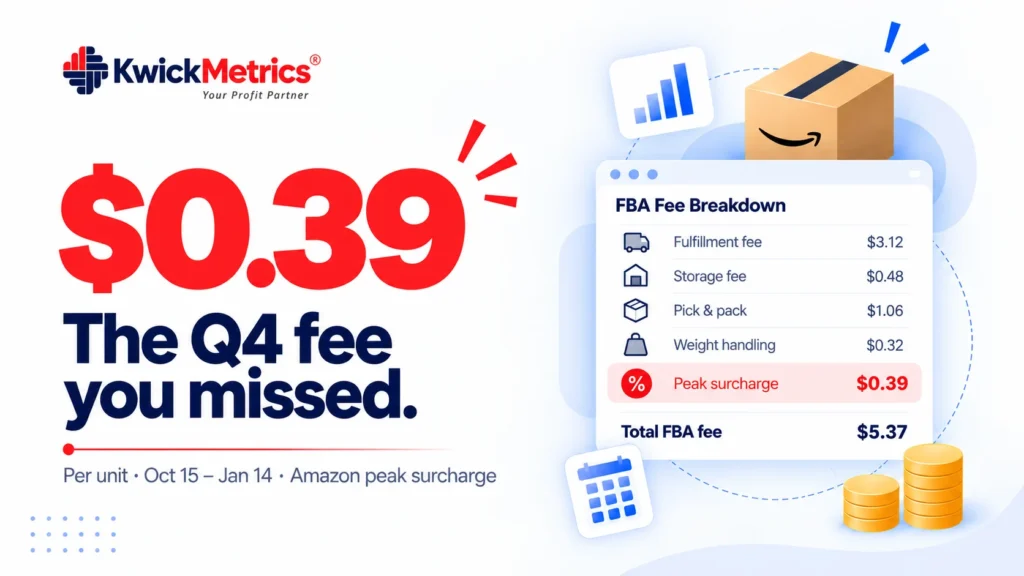
Table of Contents
Every Q4, the same pattern plays out. Sellers stock up, launch campaigns, and watch revenue climb — then discover in January that margin didn’t follow. The holiday peak fulfillment fee alone adds $0.20 to $0.39 per unit sold between October 15 and January 14 (as of Amazon’s 2025–2026 fee schedule). That’s before ad bids inflate and return rates spike.
The problem isn’t that sellers don’t prepare. Every competitor blog publishes a Q4 checklist. But none of those checklists tell you what your data should look like when something goes wrong. The signals are in your P&L, your ad metrics, and your inventory reports — and they separate a profitable Q4 from one that just looks busy.
This is what five common Q4 mistakes look like from the data side, and how to catch each one before it compounds.
Why this happens
Q4 mistakes compound because the feedback loop is slow. You change a bid in October, and you won’t see the full margin impact until December — after returns, after the peak fee window closes, after the ad spend settles.
Three forces make Q4 uniquely blind:
Fee changes happen mid-quarter. Amazon’s holiday peak fulfillment fee kicks in October 15 and runs through January 14. If your P&L dashboard doesn’t isolate that fee line, every SKU looks less profitable and you can’t tell whether it’s the fee or something else.
Ad costs rise faster than conversion rates. Cost-per-click on competitive terms can increase sharply during Prime Big Deal Days and Black Friday week, but conversion rates don’t always rise at the same pace. If you’re watching revenue without watching advertising cost of sales (ACOS) at the SKU level, you’re flying blind.
Return rates spike after the holidays. Categories like electronics and apparel see higher return rates in January. Those returns erase margin on sales you already counted as profit — and if you’re reconciling manually across client accounts, you’ll catch them weeks late.
For agencies managing multiple seller accounts, multiply each blind spot by your account count. A fee miscalculation on one account is a line item. The same miscalculation across 15 accounts is a quarter’s worth of misreported client profit.
What it costs you
The real cost of Q4 mistakes isn’t the fee itself — it’s the delay in seeing it.
Here’s how to calculate the gap on your own accounts. Pull these numbers from your P&L for any SKU you sold in last year’s Q4:
| Input | Your number | Where to find it |
|---|---|---|
| Units sold, Oct 15 – Jan 14 | Sales report, filter by date | |
| Standard FBA fee per unit | Fee preview or P&L detail | |
| Holiday peak surcharge per unit | Amazon fee schedule, $0.20–$0.39 by size tier | |
| Total peak surcharge (units × surcharge) | Multiply the two rows above | |
| Q4 return rate for this SKU | Returns report | |
| Margin lost to returns | Return count × net margin |

The calculation: Add the peak surcharge total to the margin lost from returns. That’s the Q4-specific cost your standard P&L didn’t break out — per SKU, per account.
Most sellers never run this calculation because the peak surcharge doesn’t appear as its own line in Seller Central’s default reports. It’s buried inside the total fulfillment fee. You have to pull fee-level data, isolate the surcharge window, and run the arithmetic yourself.
On one account, that takes an afternoon. Across a portfolio of client accounts, it doesn’t happen — which means you report Q4 profit to clients using numbers that include margin you’ve already lost.
How to fix it
Break out the peak fee window in your P&L before October 15
Don’t wait for the fee to show up in reconciliation. Set your profit and loss tracking to isolate October 15 – January 14 as a separate date range now. Compare per-unit margin for the same SKUs in September versus the peak window. The difference is your fee exposure — and you should know it before you commit ad budget.
Set SKU-level ACOS thresholds that account for higher fees
Your break-even ACOS in Q4 is lower than in Q3, because your per-unit cost is higher. Recalculate it: take your net margin per unit after the peak surcharge, divide by your selling price, and that’s your ceiling. Any keyword or campaign running above that ceiling is losing money even if revenue looks strong.
Use your advertising analytics to flag campaigns that cross this threshold. Don’t pause them blindly — check whether the high ACOS is driven by a few expensive keywords or by broad category inflation. The fix is different for each.
Watch return rates weekly, not monthly
January returns on December sales are the most common source of Q4 margin surprise. Set a weekly check on your inventory and returns data by SKU. If a SKU’s return rate jumps above its trailing 90-day average, flag it before you reorder.
Build a Q4 fee audit into your reporting workflow
Pulling fee data manually from Seller Central works on one account. It doesn’t scale. If you’re running client accounts, the question isn’t whether you’ll miss a fee change — it’s how long it takes you to find it.
KwickMetrics breaks out every fee line at the SKU level across every connected account — Amazon and Walmart. The peak surcharge shows up as its own number, not buried inside a total. You can also ask your live data directly through Claude or ChatGPT: “Which SKUs lost margin during last year’s peak fee window?” That query runs across accounts without pulling a single report. Either way, the steps above are the ones to follow.

Doing this across multiple accounts
Everything above gets harder at scale, and the failure mode changes. On a single account, a missed fee is a margin hit. Across a client portfolio, a missed fee is a trust problem. The client sees numbers that don’t match their bank deposits, and you can’t explain the gap until you’ve audited every SKU.
The practical move: build the Q4 fee audit as a template, not a one-time exercise. Set the date range, define the fee lines to isolate, and apply it to every account on the same day. Run the return-rate check as a weekly sweep, not an account-by-account drill.
Agencies that do this before October 15 have a different Q4 conversation with clients. Instead of explaining margin gaps in January, The they’re showing clients — in real time — exactly where fees and returns are hitting, and what’s been adjusted. That’s the difference between a reporting agency and one that actually manages margin.
The agency services dashboard is built for this — every client account under one login, no per-account fees, with fee-level data already broken out.
Bring every client account under one login — no per-account fees.
Where to start
Pick one account. Pull the P&L for last year’s October 15 – January 14 window. Isolate the peak surcharge per SKU and calculate the return-rate impact. That gives you the actual margin picture — not the one the default reports showed. Then apply the same template to every account before this year’s fee window opens on October 15. The agencies that catch Q4 margin leaks do it before the fees hit, not after the clients ask. If you haven’t reviewed your holiday fee exposure yet, start there.
Get Your Questions Answered (FAQ)
The holiday peak fulfillment fee applies to units shipped between October 15 and January 14, as of Amazon's 2025–2026 fee schedule. The surcharge ranges from $0.20 to $0.39 per unit depending on size tier and weight. It applies to all FBA orders during that window, regardless of when the order was placed. Check the official fee page for the current year's rates.
Start with your selling price, subtract referral fee, standard FBA fee, the holiday peak surcharge, COGS, and any ad spend allocated to that SKU. Then subtract the margin lost to returned units — calculate this as your return rate multiplied by your net margin per unit. The result is your true Q4 margin, which is always lower than your standard P&L shows.
Three gaps cause this: the holiday peak surcharge (buried in total fulfillment fees, not broken out), January returns on December sales (erasing margin already counted), and inflated ad spend (higher CPCs that eat into margin without proportional conversion gains). Reconciling all three requires fee-level data, not summary reports.
Not automatically. First, recalculate your break-even ACOS using your Q4 per-unit cost (which is higher due to the peak surcharge). If a campaign is above your Q4 break-even but below your Q3 break-even, the issue is the fee, not the campaign. Only pause or restructure campaigns that exceed the Q4-adjusted ceiling — and check whether the overage comes from specific keywords or broad cost inflation.


Karthick Selvaraj is a Product Manager at KwickMetrics, where he leads the development of data-driven tools that help Amazon and Walmart sellers track profitability, optimize ads, and manage their business with greater clarity and control. He works closely with eCommerce brands, presents at industry events, and turns real seller pain points into intuitive product features.