Where Ecommerce Sellers Lose Time and Money Without Realising It
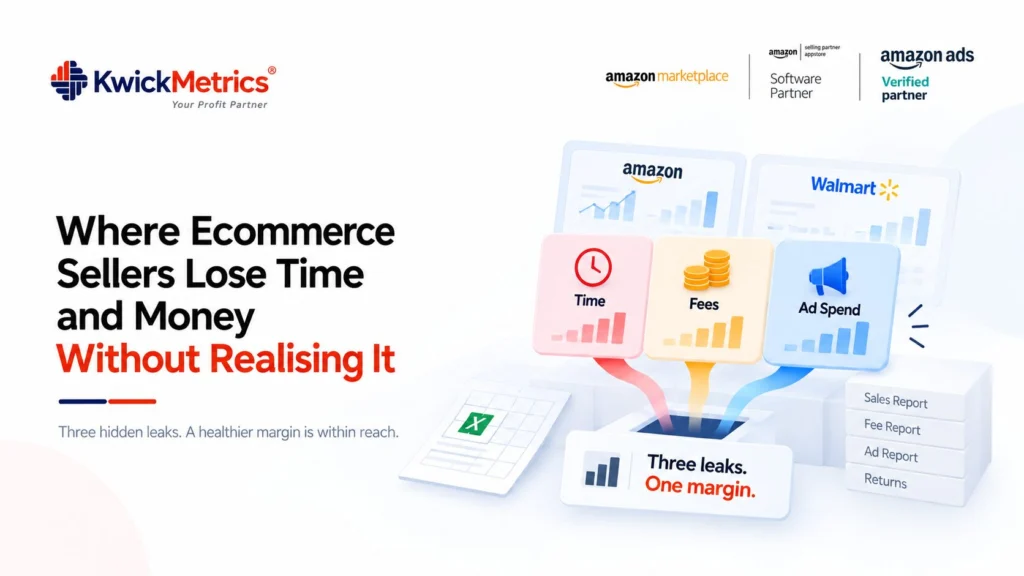
Table of Contents
- Why this happens
- What it costs you
- 1. Time spent on manual tasks
- 2. Unchecked fees and profit leaks
- Here is a template to find your own profit leak on any single product:
- 3. Ad spend with no return
- How to fix it
- Here is a template to find your own profit leak on any single product:
- Doing this across multiple accounts
- Where to start
- Get Your Questions Answered (FAQ)
Most Amazon and Walmart sellers can tell you what they sold last month. Fewer can tell you what they actually kept. The gap between revenue and real profit hides in three places: the hours spent on tasks a spreadsheet could handle, the fees that never get checked, and the ad spend that runs without anyone watching the return. They show up as margin that was never quite what the dashboard said.
Run an amazon profit calculator on your last quarter and compare it to what hit your bank account. The difference is usually in one of these three categories. This article breaks down where the money goes, what it costs, and what to do about each one.
Why this happens
Seller Central and Walmart Seller Center were not built to show you the full picture. They report revenue, units, and fees — but not in the same view, not across accounts, and not in a way that makes the real cost obvious.
Take fees alone. Amazon’s FBA fulfillment fee for a large standard item between 1 and 1.25 lb is $5.04 per unit, as of January 2026 (source: Amazon 2026 fee schedule). The 15% referral fee applies to most categories. Monthly storage runs $0.78 per cubic foot January through September, jumping to $2.40 in Q4. Since April 2026, a 3.5% fuel surcharge sits on top of every fulfillment fee.
Every one of these numbers is published. The problem is that no single report adds them up at the product level, across accounts, alongside ad spend and return costs. On Walmart, the same gap exists — WFS fees, referral rates, and storage charges live in separate reports with different update cycles.
Sellers and agencies run on revenue numbers that look healthy while the actual margin erodes underneath.
What it costs you
The cost shows up in three categories. Here is how to calculate each one using your own numbers.

1. Time spent on manual tasks
Pull up your last full working week. Count the hours spent on: downloading reports from Seller Central or Walmart Seller Center, copying data into spreadsheets, building client reports, reconciling fees against settlements, and checking ad campaigns one at a time.
| Task | Where to find your number |
|---|---|
| Report downloads and formatting | Track it for one week — count every export |
| Fee reconciliation | Time from settlement download to final check |
| Client reporting (agencies) | Hours between data pull and sent report |
| Ad performance review | Time spent inside campaign manager per session |
Multiply your total weekly hours by your loaded hourly cost. Multiply by 52. That is your annual cost of manual data work. For agencies, multiply again by the number of client accounts.
2. Unchecked fees and profit leaks
Amazon changes its fee structure multiple times a year. The 2026 update alone added $0.08 per unit on average to FBA fees (source: Amazon Seller Central, 2026). Products sitting longer than 15 months incur aged inventory surcharges of $0.35 per unit or $7.90 per cubic foot, whichever is greater.
Here is a template to find your own profit leak on any single product:
Your selling price: $____
Minus referral fee (15%): −$____
Minus FBA fee (check your tier): −$____
Minus fuel surcharge (3.5% of FBA fee): −$____
Minus COGS: −$____
Minus monthly storage (pro-rated): −$____
Minus return cost (your return rate × per-unit cost): −$____
= Actual profit per unit: $____

Run this for your top 10 SKUs. Compare it to what you thought your margin was. The gap is your profit leak.
On Walmart, repeat with WFS fees and Walmart referral rates. If you sell on both, the combined leak across marketplaces is what matters.
3. Ad spend with no return
Your ACOS (advertising cost of sale — ad spend divided by ad revenue) tells you the percentage of each ad-driven sale that went to Amazon. Your TACOS (total advertising cost of sale — total ad spend divided by total revenue) tells you how much advertising weighs on your whole business.
Neither tells you which specific search terms are spending without converting. That requires pulling a search term report, filtering for terms with spend and zero orders, and doing it regularly enough to catch waste before it compounds.
These three categories stack. A seller losing margin to unchecked fees, spending hours on manual reconciliation, and running ads without search-term audits is losing in all three at once.
How to fix it
Each leak has a different fix. None of them require new staff or a bigger budget.
Here is a template to find your own profit leak on any single product:
Automate the data pull
AI tools and amazon seller analytics platforms can pull your sales, fee, and ad data into one view without manual exports. The ones worth using connect to your Amazon and Walmart accounts and update automatically.
What to look for: product-level profit after every fee, across every connected account, on both Amazon and Walmart. If a tool only covers ads, it misses fees. If it only covers Amazon, it misses Walmart. KwickMetrics does this across both marketplaces and unlimited accounts on every plan — but the principle holds regardless of which tool you choose. Stop exporting CSVs.
Run a profit audit at the product level
The template above is a manual version of what a profit audit does automatically when connected to your account data. Check every product against its real fees — not last year’s. Amazon’s 2026 FBA rates took effect January 15, the fuel surcharge landed April 17. Any margin calculation using older fee data is wrong.
Audit your ad spend by search term
Open your search term report. Sort by spend, descending. Every search term with spend and zero orders in the last 30 days is a candidate for negation. Every product target with a high ACOS and no organic rank improvement is a candidate for pausing.
This is not about cutting budget — it is about redirecting it. The same spend, pointed at converting search terms, produces more revenue without a higher budget. Even a manual review once a week catches the biggest waste.
Reclaim what Amazon owes you
Lost inventory, damaged units, and overcharged fees are all reimbursable. Amazon’s claim window is 60 days from the issue date — every unit you do not claim within that window is margin you earned and never collected.

Walmart has a similar process through WFS, though timelines and documentation differ.
Doing this across multiple accounts
Everything above gets harder at scale. An agency managing client accounts hits every one of these problems multiplied by account count — and the manual version stops being viable after the second or third.
The fix is the same, but the tool requirements change. You need a platform that connects multiple seller accounts under one login, shows profit and fees per account at the product level, and does not charge per account — because per-account pricing turns visibility into its own profit leak.
KwickMetrics connects unlimited Amazon and Walmart accounts on every plan, with product-level P&L, ad analytics, and reimbursement tracking across all of them. Whatever tool an agency uses, the non-negotiable is that it works across marketplaces and accounts without multiplying the cost.
The alternative — downloading reports from each account and reconciling in separate spreadsheets — is the time leak from the first section, running on repeat.
Where to start
Pick one category — time, fees, or ad spend — and measure it this week. Use the templates above with your own numbers. Pull actual figures from Seller Central or Walmart Seller Center. Once you see the gap between what you thought your margin was and what it actually is, the next step becomes obvious. For background on how AI fits this picture, read what AI actually does for sellers. Then tackle the biggest leak.
Bring every client account under one login, no per-account fees.
Get Your Questions Answered (FAQ)
Unchecked fees. Amazon updates its fee structure multiple times a year, and most sellers do not recalculate product-level margins after each change. The 2026 FBA increase of $0.08 per unit and the 3.5% fuel surcharge both reduce margin on every unit sold — but only show up if you audit at the product level.
Pull your search term report from Amazon Ads and sort by spend. Any term with ad spend in the last 30 days and zero attributed orders is costing you money with no return. ACOS and TACOS give you the ratio, but the search term report shows exactly where the waste sits.
Yes. WFS fees, Walmart referral rates, and storage costs eat into margin the same way. The reporting is structured differently — Walmart Seller Center uses separate dashboards — but the underlying problem is identical: fees change, and most sellers do not recalculate after each update.
AI tools fix the data-gathering and calculation layer — the part that eats hours and introduces errors when done manually. They do not make business decisions for you. The value is surfacing numbers accurately and automatically, so you act on them instead of assembling them. The wrong tool adds a subscription. The right one replaces several.


Karthick Selvaraj is a Product Manager at KwickMetrics, where he leads the development of data-driven tools that help Amazon and Walmart sellers track profitability, optimize ads, and manage their business with greater clarity and control. He works closely with eCommerce brands, presents at industry events, and turns real seller pain points into intuitive product features.